- Home
- Mapping Future Brisbane
/
Mapping Future Brisbane
In early 2020, the State Library of Queensland put out a call for innovative and creative uses of our collections through a new initiative - the Digital Collections Catalyst in Residence. Dr. Keir Winesmith was successful with his proposal to use State Library's historic map collections to create machine learning models that visualise different possible futures for the city.
By Dr. Keir Winesmith, Digital Collections Catalyst 2020
About | Making Maps with Machines | Old Windmill Tower | Create Your Own Map
I began my research in mid 2020 with a deep dive into the Library’s collection of Brisbane maps and histories, the outcomes of which are detailed in a post on the State Library’s blog: Tracing the Past.
I then spoke to Indigenous and non-Indigenous people of Brisbane, urban planners and designers, historians, writers, artists, academics, and loads of bartenders, baristas and restaurant staff.
I also met with leaders and staff from the State Library of Queensland, Brisbane Open House, Cross River Rail Delivery Authority, QLD Government Architect, QLD Museum of Lands, Mapping and Surveying, and Brisbane City Council. And read and analysed the responses to the project’s framing survey What’s your vision for future Brisbane?. This is all described in a second post: Shaping the Future.
Building on this research, I began experimenting with different ways of modeling Brisbane’s future. I also set out to build an interactive web interface that would enable people to create their own vision for the city using a few simple tools.
These interests combined to form Mapping Future Brisbane, a project which, at its core, asks;
How can maps of Brisbane’s past be used to inform its possible futures?
Mapping Brisbane
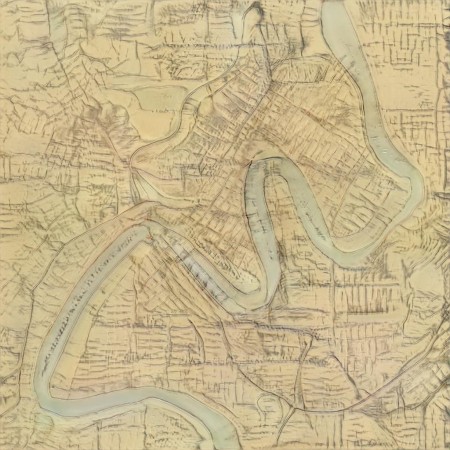
After first spending time walking around Mianjin/Meanjin, Binbilla, Wilwinpa and Tumamun to the north and Cumbukiepa, Kuilpa, Walon-koppa and Corella to the south, I began trying to trace post-colonial Brisbane’s urban story by looking at hundreds of maps and talking to a range of people and organisations. The State Library has thousands of maps of Queensland, Brisbane and even local neighbourhoods, tracing from colonisation through to the early 21st century. These maps, and many more from other cultural, historic and government institutions, were used in this project, alongside data from the Australian Bureau of Statistics, interviews, deep research and a formative survey.
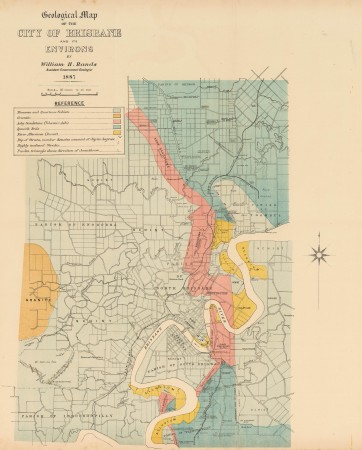
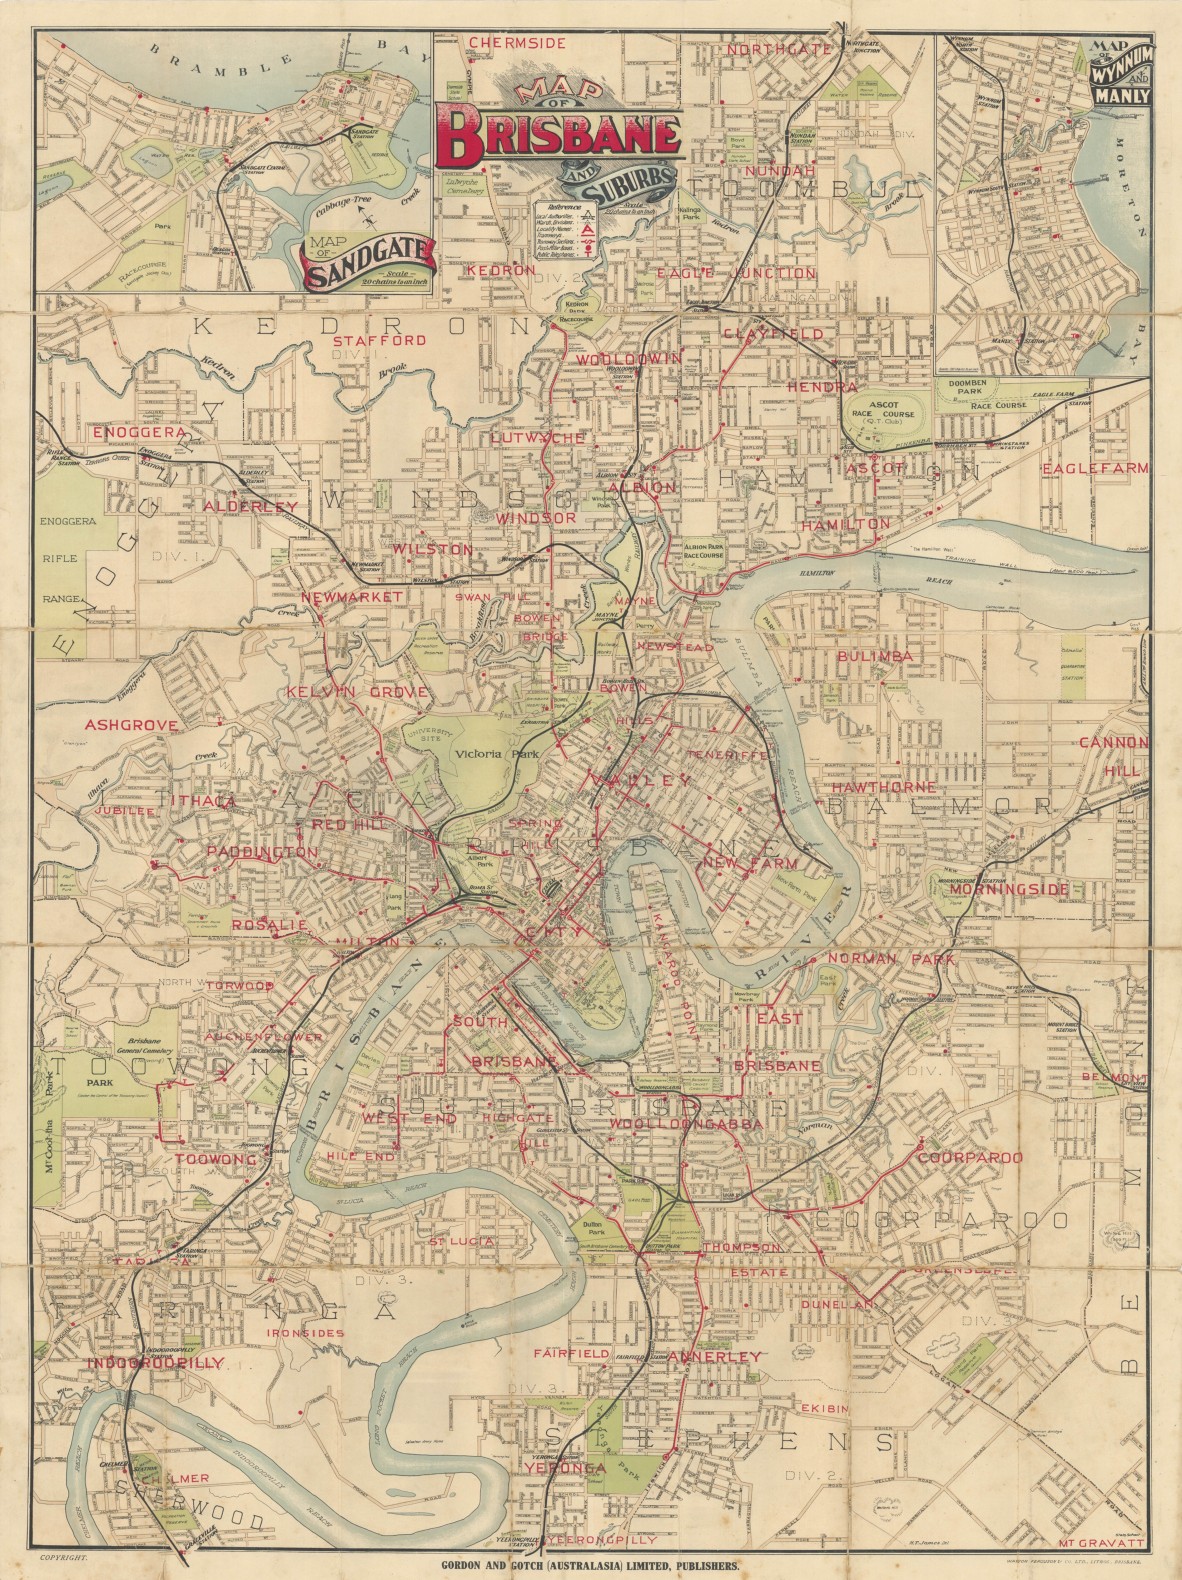
The Library’s collection includes maps of boundaries and suburbs, maps of parcels of land for sale, maps of flood waters, maps of geology, maps of the tram lines and roads - hand drawn, computer generated, topographic, cadastral and many more, going back to the early 1800s. With its iconic river, Brisbane is an eminently mappable city.
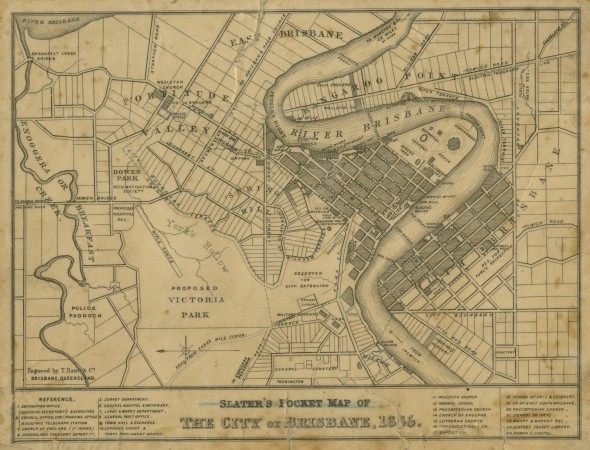
Brisbane’s earliest maps are scattered throughout the east of the continent as Brisbane was colonised in the mid-1800s when other centers, like Sydney and Melbourne, were more established. As such, broadening the scope to include the collections of the QLD’s Museum of Lands, Mapping and Surveying, QLD State Archives, State Library of NSW, National Archives, National Library and whatever else I could find in Trove (a national digital treasure) enabled an interesting meta-analysis.
These early maps, like all maps, are intensely contested documents. They depict land as seen through the cartographer or illustrator’s eyes and are framed by the objectives of that particular commission.
For early Brisbane, these maps depict Aboriginal Country taken, often violently, and never willingly or legally ceded. The land was divided and sold by the Government as it created the first boundaries and features of the growing Brisbane colony.
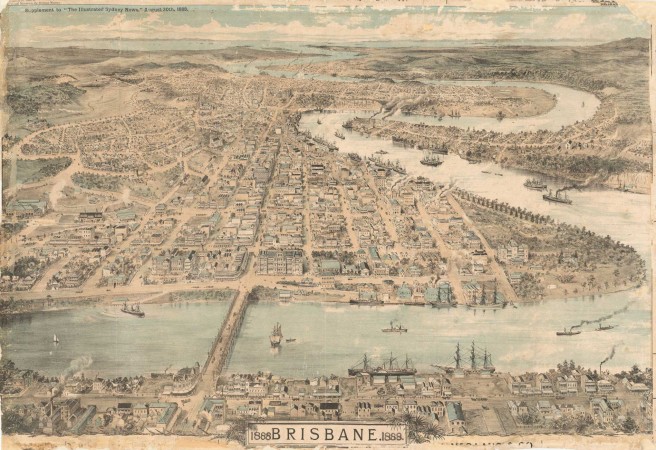
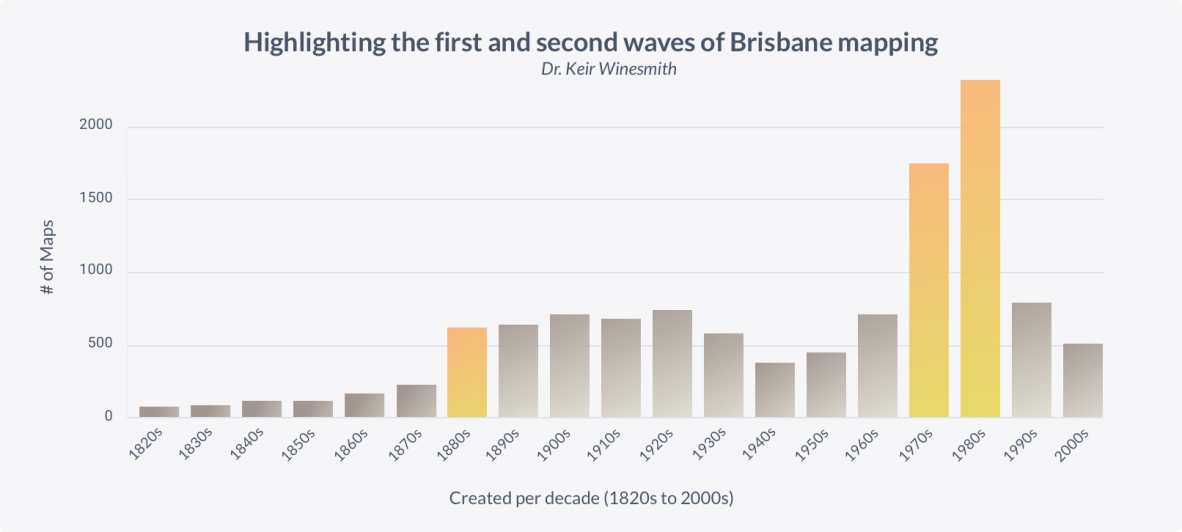
When reviewing these maps, in aggregate and over time, a clear pattern emerges. There have been two distinct waves of Brisbane mapping, first around the 1880s and second around the 1980s. I believe we are now in the third wave. My research shows these waves of mapping coincide with waves of development and renewal.
While researching the first wave of mapping I encountered two panoramas captured either side of the 1880s, both shot from the deck of the Old Windmill in Spring Hill, north of downtown Brisbane. The first in 1862, by an unidentified photographer, is in the State Library’s collection. The second, from 1895, was taken by Alfred Henry Elliott and immortalised in the Museum of Brisbane’s View from Here exhibition. When compared, they show the explosive growth of this period. Inspired by these two panoramas I created a third panorama in 2020, which Olivia Kelly and I juxtapose with Alfred Henry Elliott’s panorama in a short photo essay on the Old Windmill. You can explore both panoramas below using the white arrows.
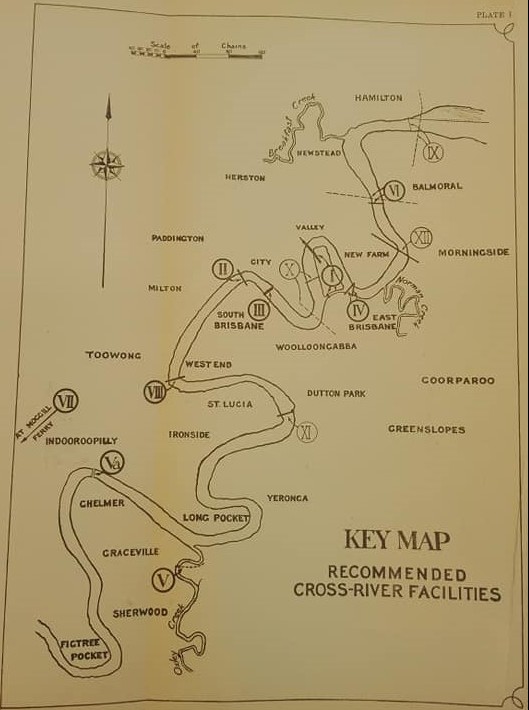
Brisbane’s scale and density enables it to reinvent itself in a way that, I believe, that no other capital in Australia can. It is a city with latent potential, growing and evolving without a concrete identity established in Australia’s collective public consciousness. Brisbane’s story isn’t yet written, as made clear by the plethora of plans and strategies that plan or imagine it’s future; the 2022 New World City Action Plan, Brisbane CityShape 2026, Brisbane Vision 2031, Future Brisbane Blueprint and Shaping SEQ are just a few of the recent ones. Going back in time you’ll find some amazing documents such as the report from the 1926 Cross River Commission which recommended 12 new river crossings.
However, before we can look into the future, we should learn from the past.
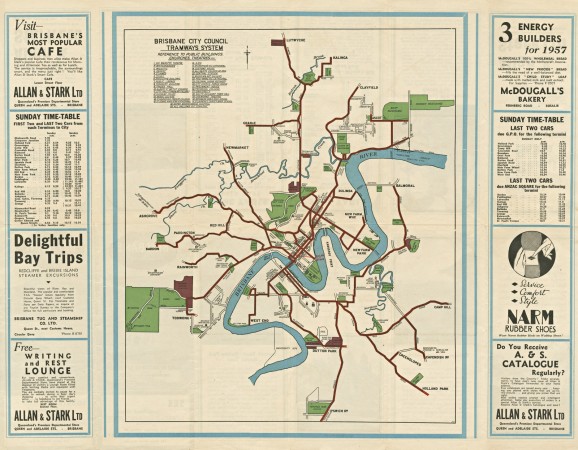
Brisbane, the young colonial outpost, was opened to free settlers in 1842 and in 1859 Queensland was made a state with Brisbane as the capital. However, its first real accelerated change happened in and around the 1880s. In 1876 the town’s first railway station opened: Roma Street Station. This was followed by the roll out of horse-drawn and then electric trams in 1880 and 90s. Electric light soon followed, as did a greater municipal focus on drainage, clean water, and public health more generally.
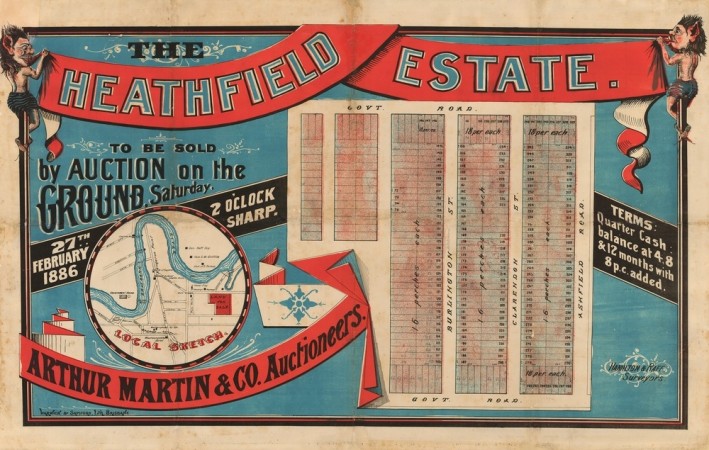
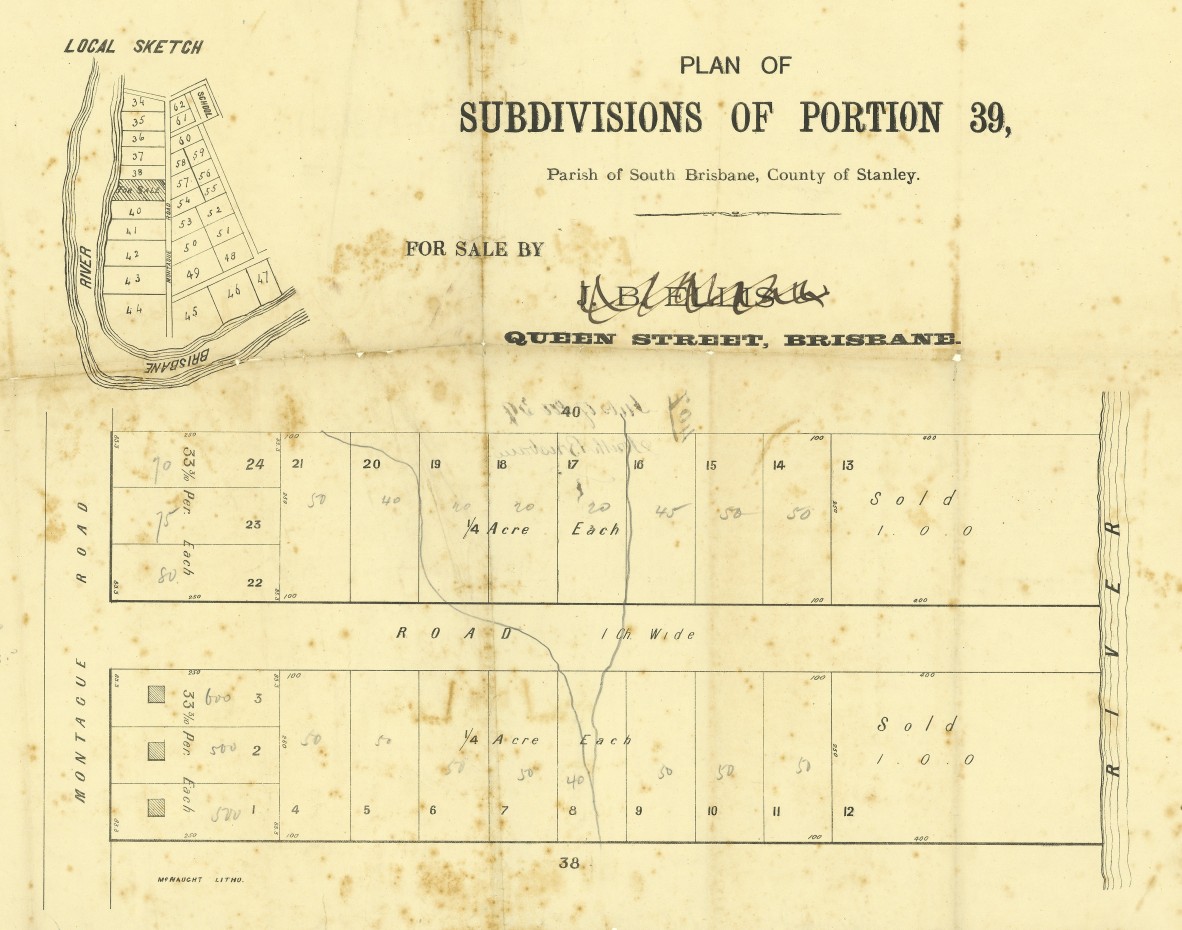
This period ushered in considerable growth for Brisbane, many land holdings were opened up to new landowners and speculators by the government. In 1885, the Undue Subdivision Of Land Prevention Bill was passed to ensure large blocks were maintained to “avoid the appearance of slums”. There are over 1,000 digitised land auction posters in the State Library’s collection, hundreds of which are from the 1880s. The Library’s real estate map collection is particularly wonderful and there are many available through an interactive map on HistoryPin or you can grab the raw data and image links from the open data portal. Looking through the allotments sold around the 1880s we must acknowledge that every lot of what is Aboriginal land I saw in the archives was either sold to an Anglo-Celtic or European man, or kept by the Government.
Brisbane’s trade, physical infrastructure and population grew in response to these changes. Population went from approximately 6,000 people in 1861 to over 88,000 by the 1891 census, mainly due to migration from Britain.
Machine Generated Maps
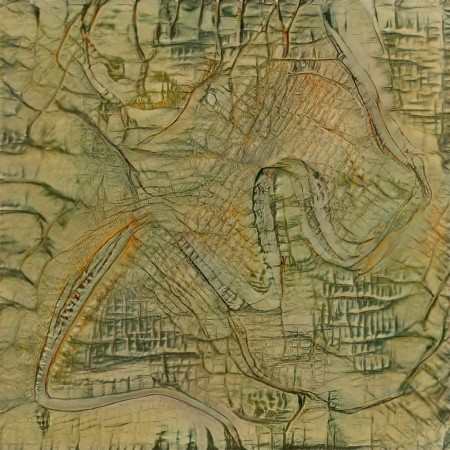
After reviewing hundreds of maps during the research phases of the project, I started working on my plan to use machine learning to create a model of Brisbane that could create its own cadastral-style maps. Machine learning is a term used to describe a broad range of predictive computational methods which, most often, take existing data as inputs in order to create new outputs that can then be tested and subsequently used to improve the model. Beyond the Library, there are really great maps in Queensland’s Museum of Lands, Mapping and Surveying; Qld State Archives; State Library of NSW; and the National Archives and National Library in Canberra. Once I’d gathered a range of maps, from the Library and these others sources, I had what I needed to make a machine learning model.
The machine learning variants of artificial intelligence used here require a lot of training data. I use the term artificial intelligence hesitantly, as these systems are better thought of intricate algorithms, built on real world inputs with a dash of randomness - they are not intelligent as we understand the word. Put another way, the term 'machine learning' stands in for a range of predictive computational methods which use existing data to generate new, unique outputs that can be used to train the model in order to improve further outputs. For this project, the input “data” are maps of Brisbane.
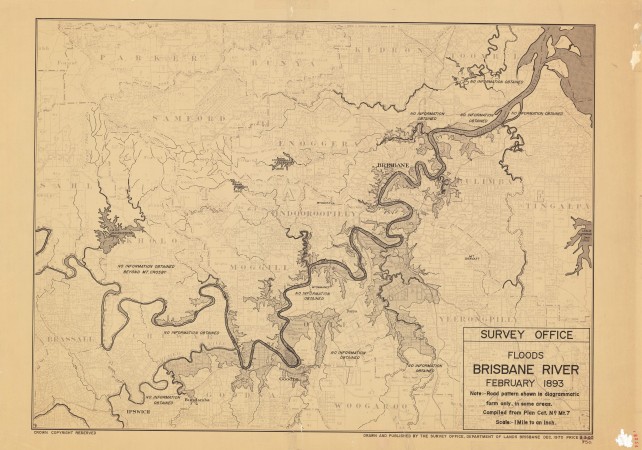
Although there are thousands of maps of Brisbane, the vast majority aren’t suitable for this project. Some are too detailed (showing just one suburb or block, real estate maps for example) or not detailed enough (showing the whole of South East Queensland or the whole state). Many from the 1800s only show Brisbane as it was then, understandably, however the area I’m looking to recreate extends well beyond the city’s early colonial boundaries. Others still were designed to document specific events, such as the 1893 flood. After a lot of searching and vetting, I was limited to less than 100 maps that showed the area I was interested in and could be productively fed into the machine learning model. These maps are beautiful and incredibly diverse.
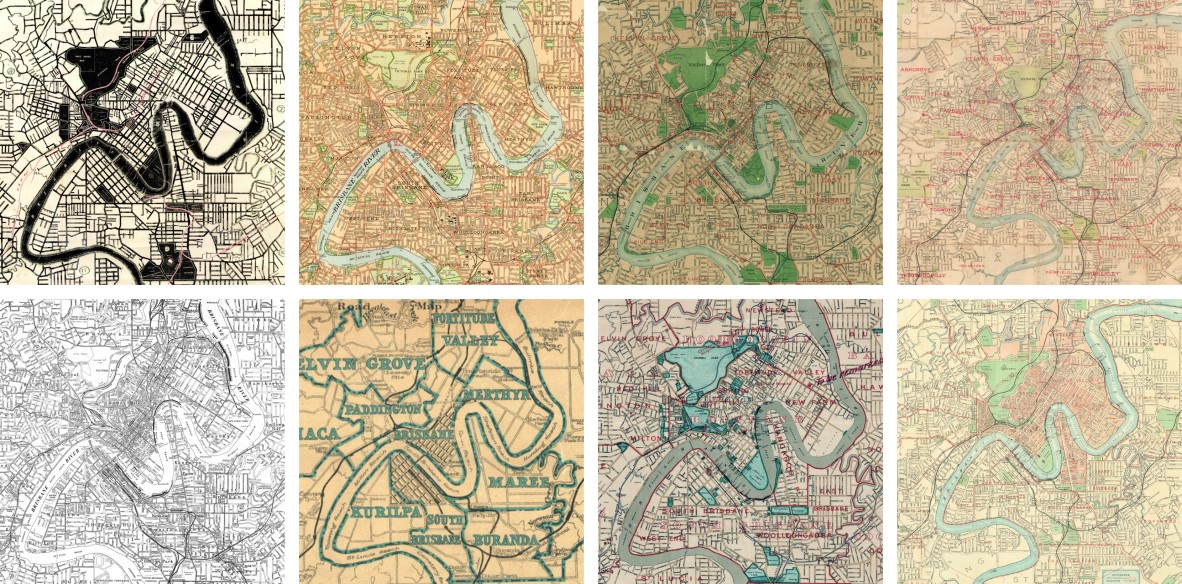
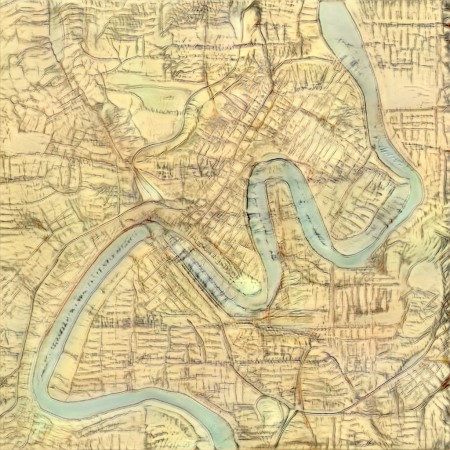
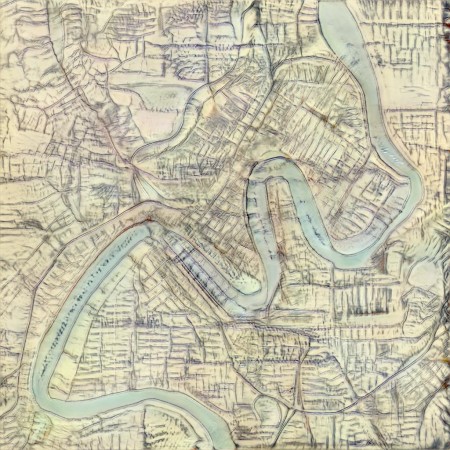
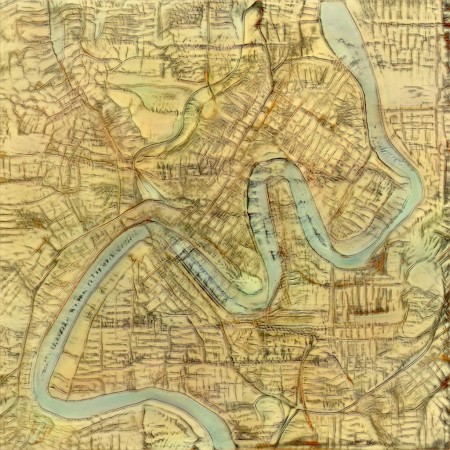
Through a complex set of steps that’s fully documented in Making Maps with Machines I created a StyleGAN model that can generate an infinite number of map images that adhere to the core elements of Brisbane’s topography and urban development that are encoded in these wonderful old maps.
This animation is called a latent space walk, which is machine learning jargon for generating visual transitions between randomly selected predictive outputs from the model.
Building on this, I have also created a StyleGAN model that generates maps of Queensland based on more than a thousand maps from across the whole state. This exploration is also documented in Making Maps with Machines.
This animation is called a latent space walk, which is machine learning jargon for generating visual transitions between randomly selected predictive outputs from the model.
I’ve posted the Brisbane and Queensland StyleGAN models on the RunwayML platform so that others can adapt, build on or totally retrain them. They’ll soon be added to the State Library’s open data system, along with a selection of images generated during the different phases of the development process, to ensure ongoing open access.
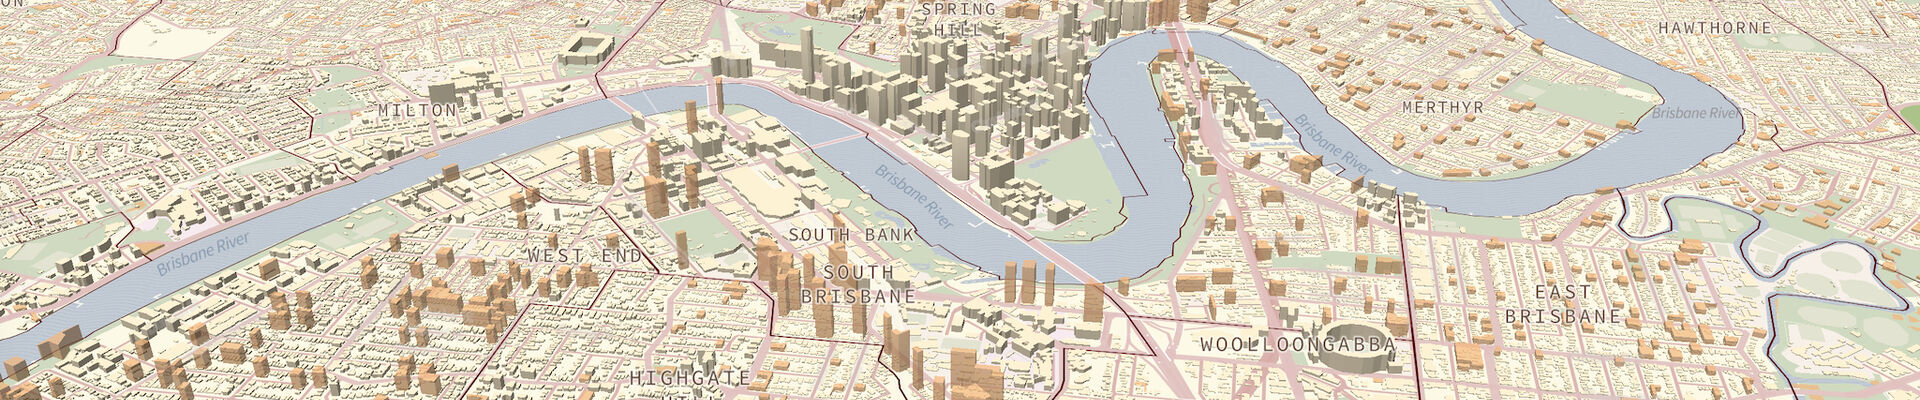
Brisbane in the year 2036
Inspired by the responses to the project’s framing survey What’s your vision for future Brisbane? I wanted to create an interactive map interface that enables users to change the population density, add new green spaces and create their own map of Brisbane.
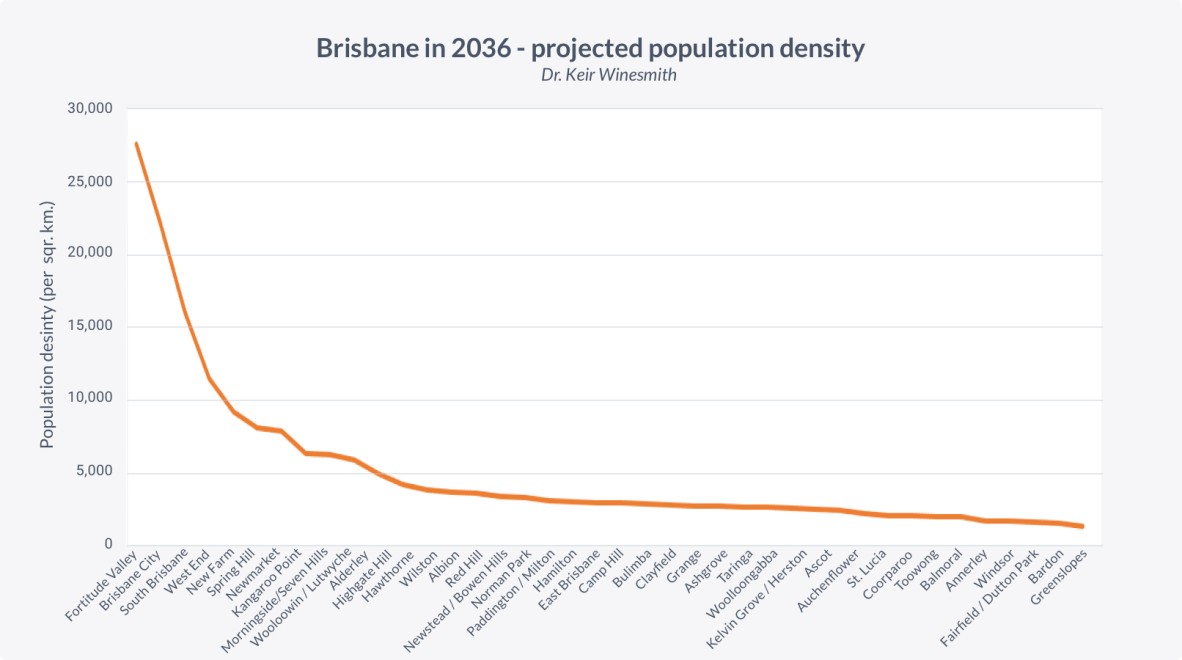
However, before creating a web application, I needed a usable population model for 2036. Brisbane is a fast growing state capital that, like all Australian cities, currently enjoys low population density by global standards. By first analysing the last 30 years of population data, and then looking forward to 2036, I created a suburb-by-suburb growth model for the city. I weighted the model to preference recent demographic changes, new building developments, planned public transport (especially the Cross River Rail project) and patterns I saw in the more recent maps.
I’ve included suburbs, using the ABS’s Statistical Area Level 2 suburban boundaries (SA2), that were included in Brisbane’s old tram network as my study area. These areas, from Fortitude Valley to Greenslopes, were then ranked by projected 2036 population density, according to the model. Given the highly concentrated downtown development and ring of low density suburbs, there is often a very steep climb in population density between neighbouring suburbs. Note the vast difference between Fortitude Valley and areas that ring the city.
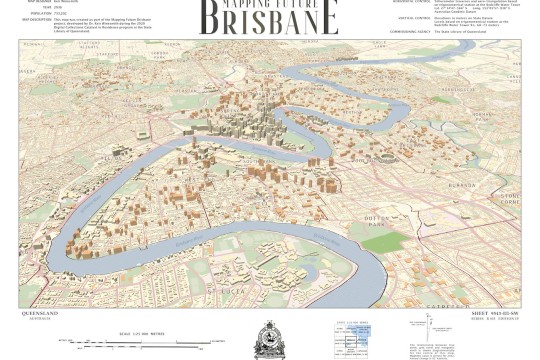
To actually build the interactive map, I collaborated with Giraffe, an Australian technology start-up that creates tools for urban designers, architects and developers to simplify and improve the process of designing cities.
To accommodate the city’s growing population, Giraffe developed a building placement algorithm for the new dwellings (high, medium and low density) that would be needed. They first sampled all the buildings in each SA2 suburb, created clusters of 2 or 3 adjacent buildings and then placed new, higher density, buildings on top of them according to a random sampling of potential locations to about 10% of the developable area. This is intended to emulate how development might feasibly occur, but should not be read as a recommendation of where and how many new buildings should be built.
I selected map colours and styles so that it looks like the gorgeous old maps of Brisbane from the 1920s and 1970s that first inspired this project. The map style is now freely available on Mapbox Studio for anyone to modify or reuse.
Create your own map
Next: Making Maps with Machines
About the Digital Collections Catalyst
- Dr. Keir Winesmith is the inaugural Digital Collections Catalyst for 2020. He has worked at the intersection of digital, culture and place for the last two decades. Keir created and collaborated on immersive and interactive cultural experiences in Australia, the U.S. and Europe, and in 2018 was named in Fast Company's '100 Most Creative in Business' for his work in this area. He currently leads a small strategic design agency and is an Adjunct Professor at UNSW Art & Design.
- State Library created the Digital Collections Catalyst initiative for developers and creatives to support innovative and creative uses of our digital collections and collections data. We are interested in highly creative and experimental ideas that bring together technology with cultural heritage to inspire Queenslanders through State Library collections. Learn more about the Digital Collection Catalyst initiative here.