Mapping Future Brisbane, part 1: Tracing the past
By Dr. Keir Winesmith, Digital Collections Catalyst 2020 | 7 September 2020
My project seeks to understand Brisbane’s history through maps of the past, to help predict its future. Earlier in the year, State Library of Queensland put out a call for innovative and creative uses of their collections through their new Digital Collections Catalyst in Residence program. I proposed a project that would use the Library’s historical maps, and other inputs, to create a machine learning model that would help visualise different possible futures for the city. Machine learning is a term used to describe a broad range of predictive computational methods which, most often, take existing data as inputs in order to create new outputs that can then be tested and subsequently used to improve the model.
Mapping Future Brisbane is a project that, at its core, is trying to understand how the maps and patterns of a city’s past can be used to inform its possible futures. After first spending time walking around Mianjin/Meanjin, Binbilla, Wilwinpa and Tumamun to the north and Cumbukiepa, Kuilpa, Walon-koppa and Corella to the south, I began my research into post-colonial Brisbane’s urban story by looking at hundreds (maybe thousands) of maps, talking to lots of people and organisations, and analysing the generous responses and personal visions that people had supplied through the project’s framing survey “What’s your vision for future Brisbane?”
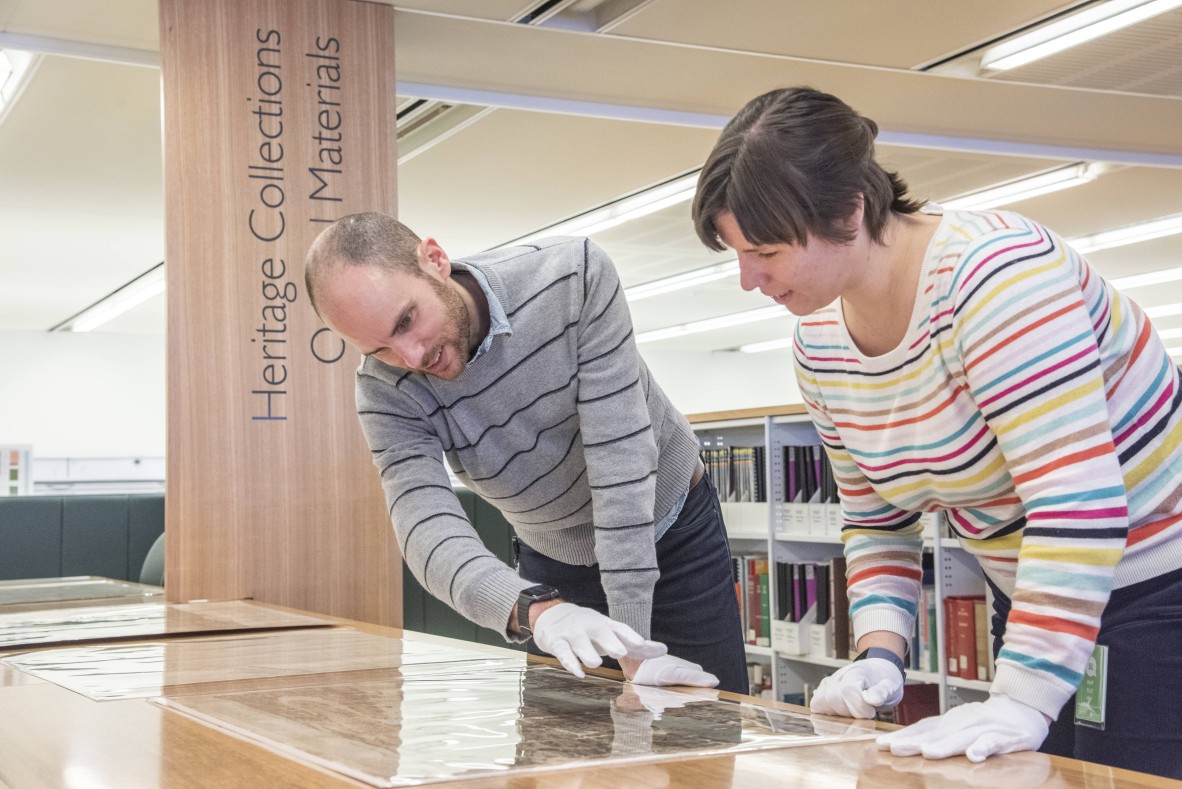
Digital Collections Catalyst, Dr. Keir Winesmith, examines historical maps in the Heritage Collections area at State Library of Queensland with Rachel Merrick, Coordinator of Digital Library Initiatives
Exploring Brisbane’s history through its maps
I started by searching through the thousands of maps available on the State Library of Queensland online catalogue. Their collection includes maps of boundaries and suburbs, maps of parcels of land for sale, maps of flood waters, maps of geology, maps of the tram lines and roads - hand drawn, computer generated, topographic, cadastral and many more, going back to the early 1800s. I highlighted those I wanted to see in person and noted those with intriguing descriptions that weren’t digitised. Happily, some of those maps have since been digitised, enabling everyone to access them. A good example of the newly digitised maps is this amazing hand shaded map of the greater Brisbane area showing which areas were developed between the mid-1800s and 1985.
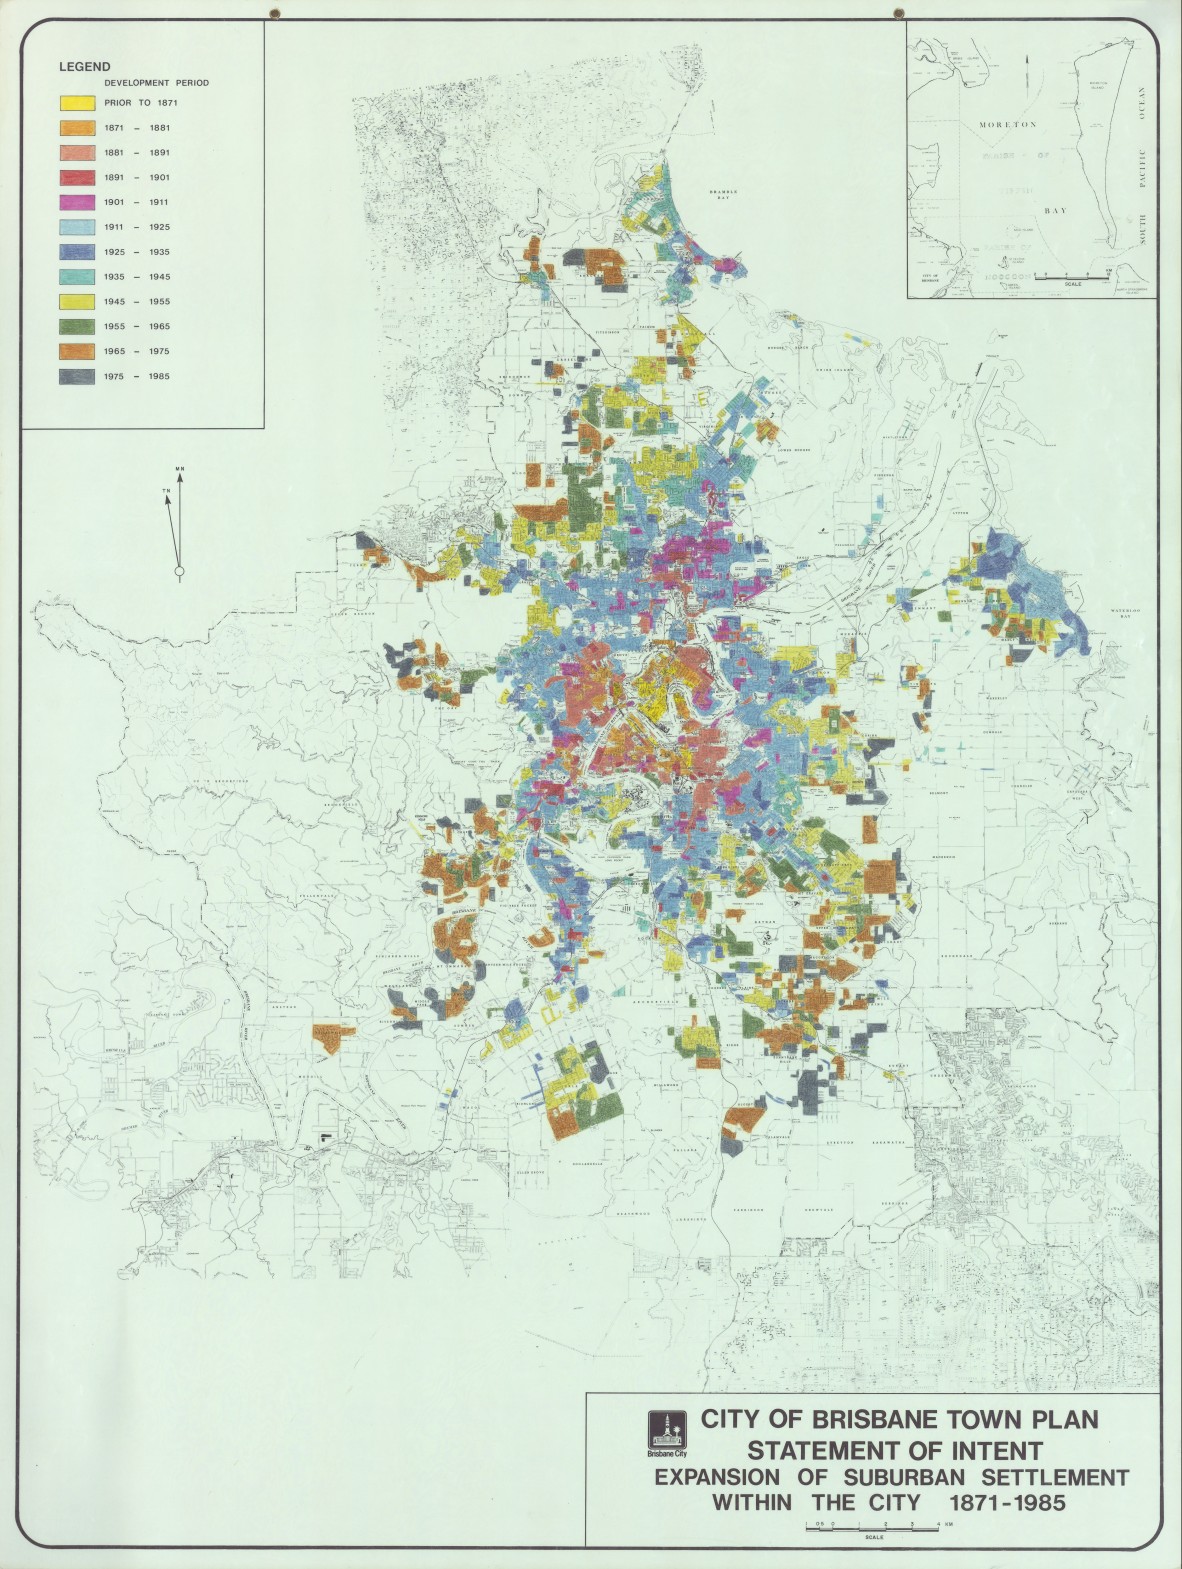
Expansion of suburban settlement, 1871-1985
I then broadened my online maps research to include the collections of the QLD’s Museum of Lands, Mapping and Surveying, QLD State Archives, State Library of NSW, National Archives, National Library and whatever else I could find in Trove (a national digital treasure in my opinion). There are thousands of maps spread across these archives and libraries, which enabled an interesting meta-analysis of Brisbane maps, which I explain below.
Brisbane’s earliest maps are scattered throughout the east of the continent as Brisbane was colonised in the mid-1800s when other centers, like Sydney and Melbourne, were more established. These early maps, like all maps, are intensely contested documents. They depict land as seen through the cartographer or illustrator’s eyes and are framed by the objectives of that particular commission. Mapping is not a neutral act, which is important when developing a predictive model based on historical maps and demographic change as the resultant model could encode and then repeat any mistakes or biases of the past. This is a common problem with machine learning which has made headlines recently through its problematic use in the criminal justice system, automation in recruitment, facial recognition, who gets access to credit and even representation within museum collections. These issues, especially as they relate to cultural heritage, have been a focus of my recent academic research at Sydney’s UNSW and well documented by academics in Australia and all over the world.
For early Brisbane, these maps depict Aboriginal Country taken, often violently, and never willingly or legally ceded. The land was divided and sold by the Government as it created the first boundaries and features of the growing Brisbane colony. Looking through the allotments sold around the 1880s we must acknowledge that every lot of what is Aboriginal land I saw in the archives was either sold to an Anglo-Celtic or European man, or kept by the Government.
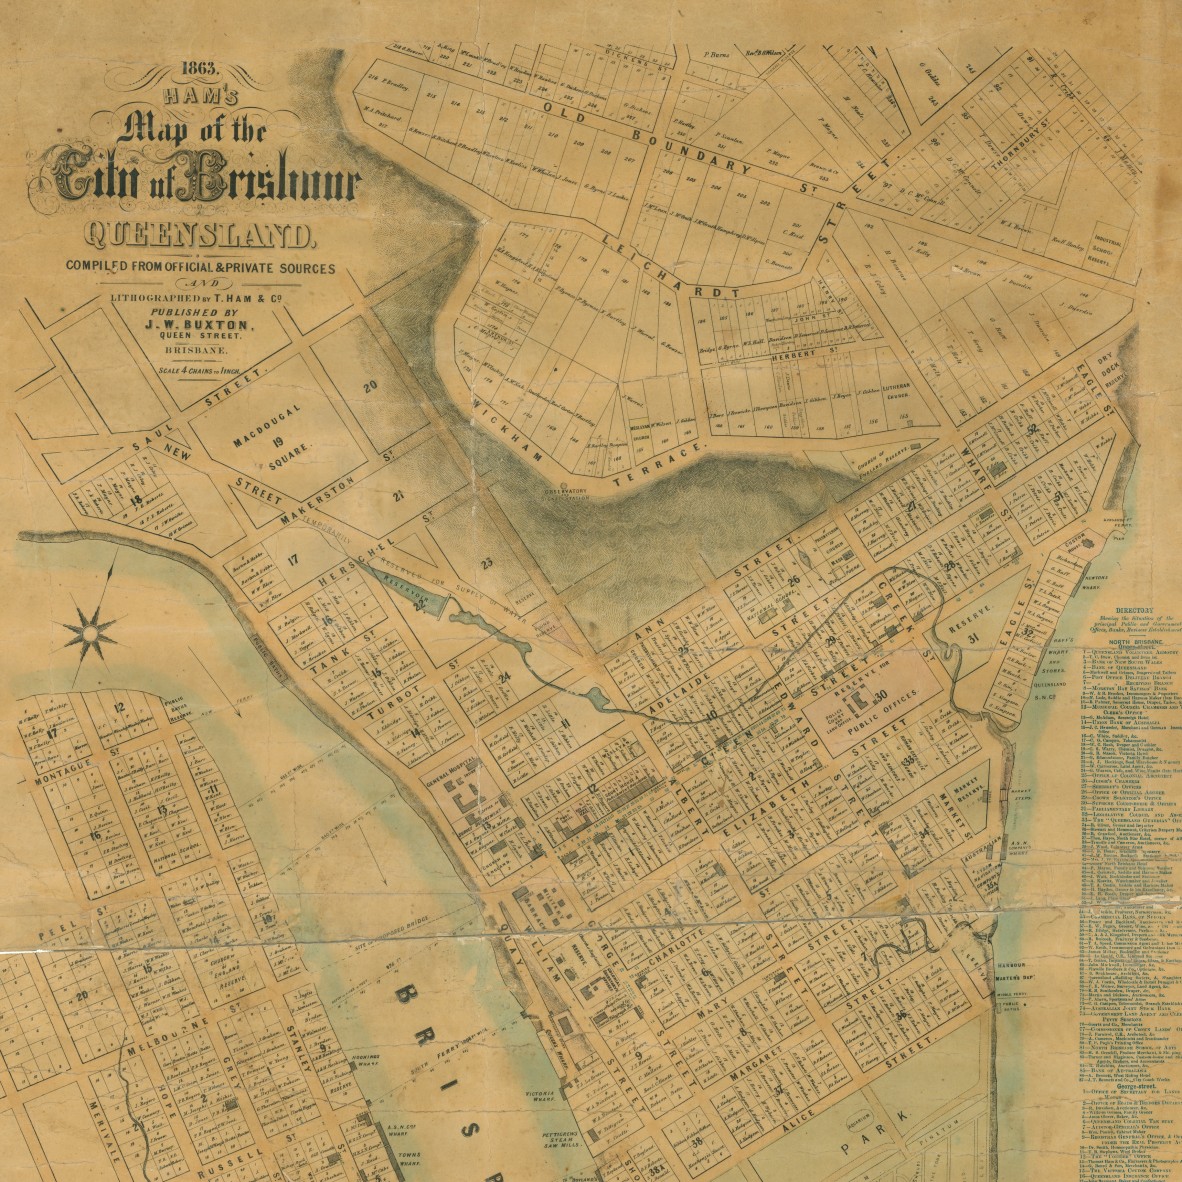
Ham's map of the city of Brisbane, Queensland, 1863 ; https://hdl.handle.net/10462/deriv/229369
Patterns of mapping, new development and urban renewal
Upon reviewing these maps in aggregate over time a clear pattern emerges. There have been two distinct waves of Brisbane mapping, first in the 1880s and the second in the 1980s. I believe we are now in the third wave. These waves of mapping coincide with waves of development and renewal. Let me explain.
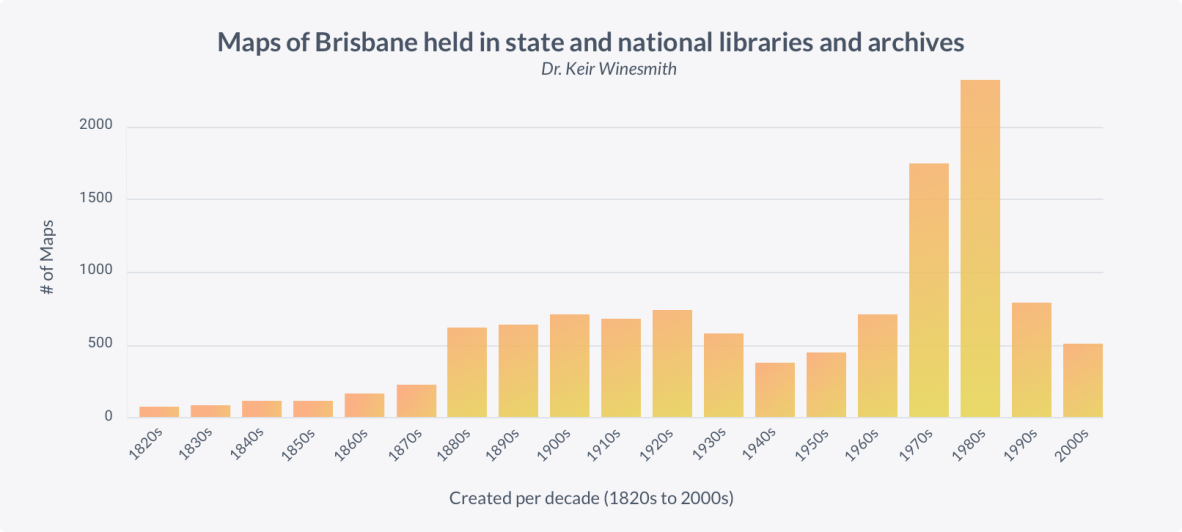
Maps of Brisbane held in state and national libraries and archives: Number of maps created per decade (1820s-2000s)
The first maps that entered our nation’s collections were created in the 1820s, with items such as John Oxley’s early maps of Brisbane River. From the 20s through to 1860s and 70s there were just a few maps a year being created, as the young colony grew. In the 1880s and 90s there was an explosion of both mapping and development. Large parcels of lands were opened up and auctioned off. State Library’s 1000+ real estate map collection is particularly wonderful and there are many available through an interactive map on HistoryPin or you can grab the raw data and image links from the open data portal. Mapping rates then plateaued for almost a hundred years, before jumping up again in the 1970s and 80s as the city prepared for the 1982 Commonwealth Games and Expo 88... Together We'll Show the World! I’ll go into more detail about these waves of mapping, development and renewal in later writing; building on the wealth of material about these periods in books, journals, magazines and other sources at the Library.
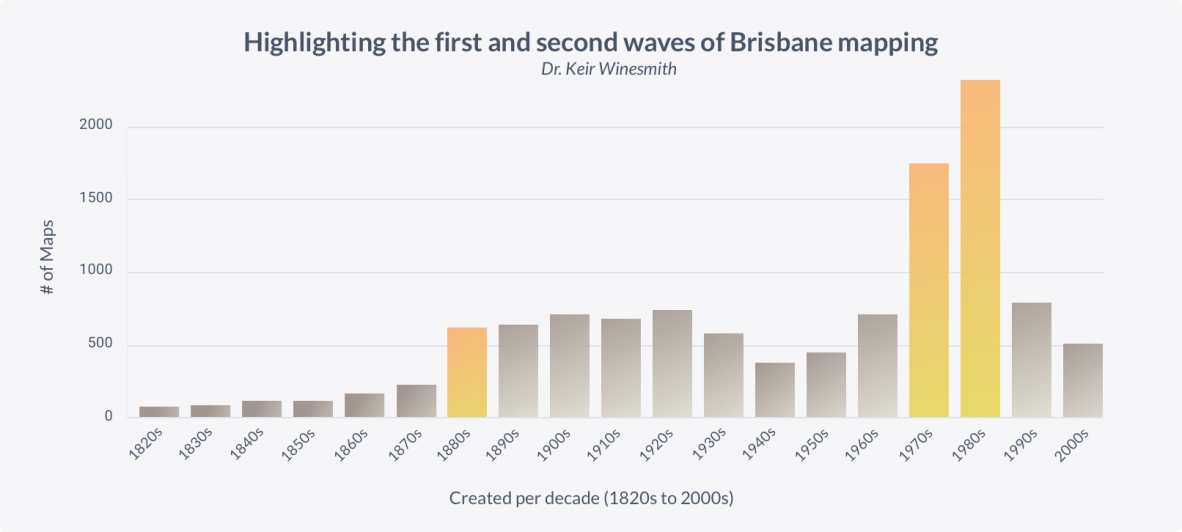
Highlighting the first and second waves of Brisbane mapping: Number of maps created per decade (1820s-2000s)
As we move into the 2010s and 2020s, the vast majority of maps are born digital. Think of platforms like Google Maps and Google Earth, Apple Maps and OpenStreetMap, the online planning or geographic archiving resources offered by the state, such as Brisbane City Plan, Virtual Brisbane, Queensland Globe, QTopo, QImagery, or detailed maps of specific areas for new building developments or even new rail lines. In many cases these maps aren’t maps as we traditionally understand them, they are; layers of data, software services, fully integrated digital platforms, 3D models and many other forms.
In this third wave of development there is, yet again, an order of magnitude more maps being created and shared. I now wonder if this project was repeated for other cities around the Australian continent, or around the world, if such distinct patterns would emerge.
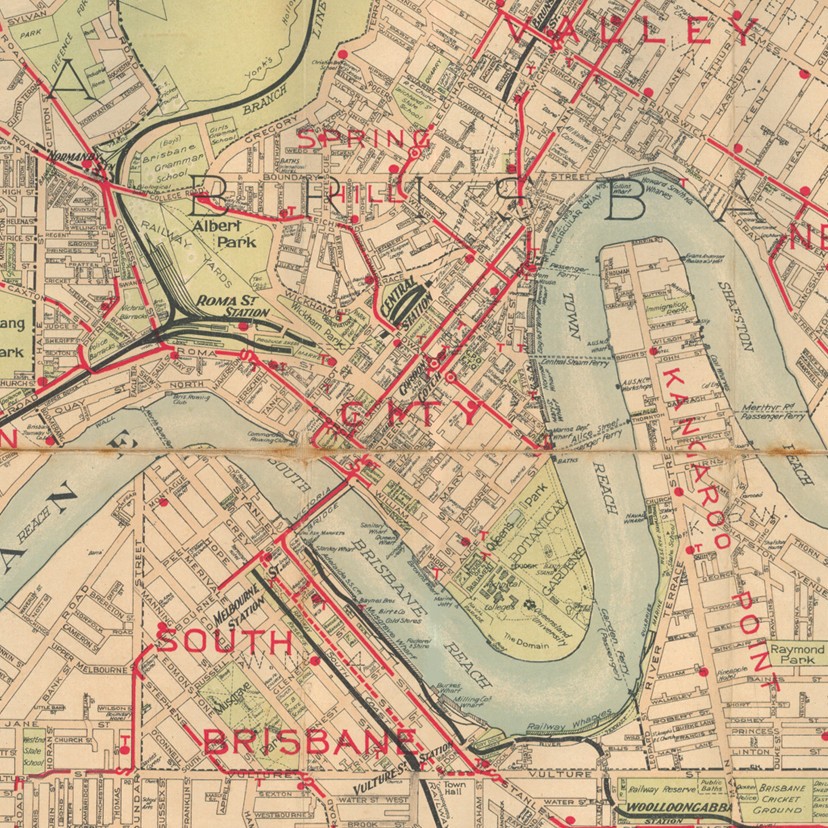
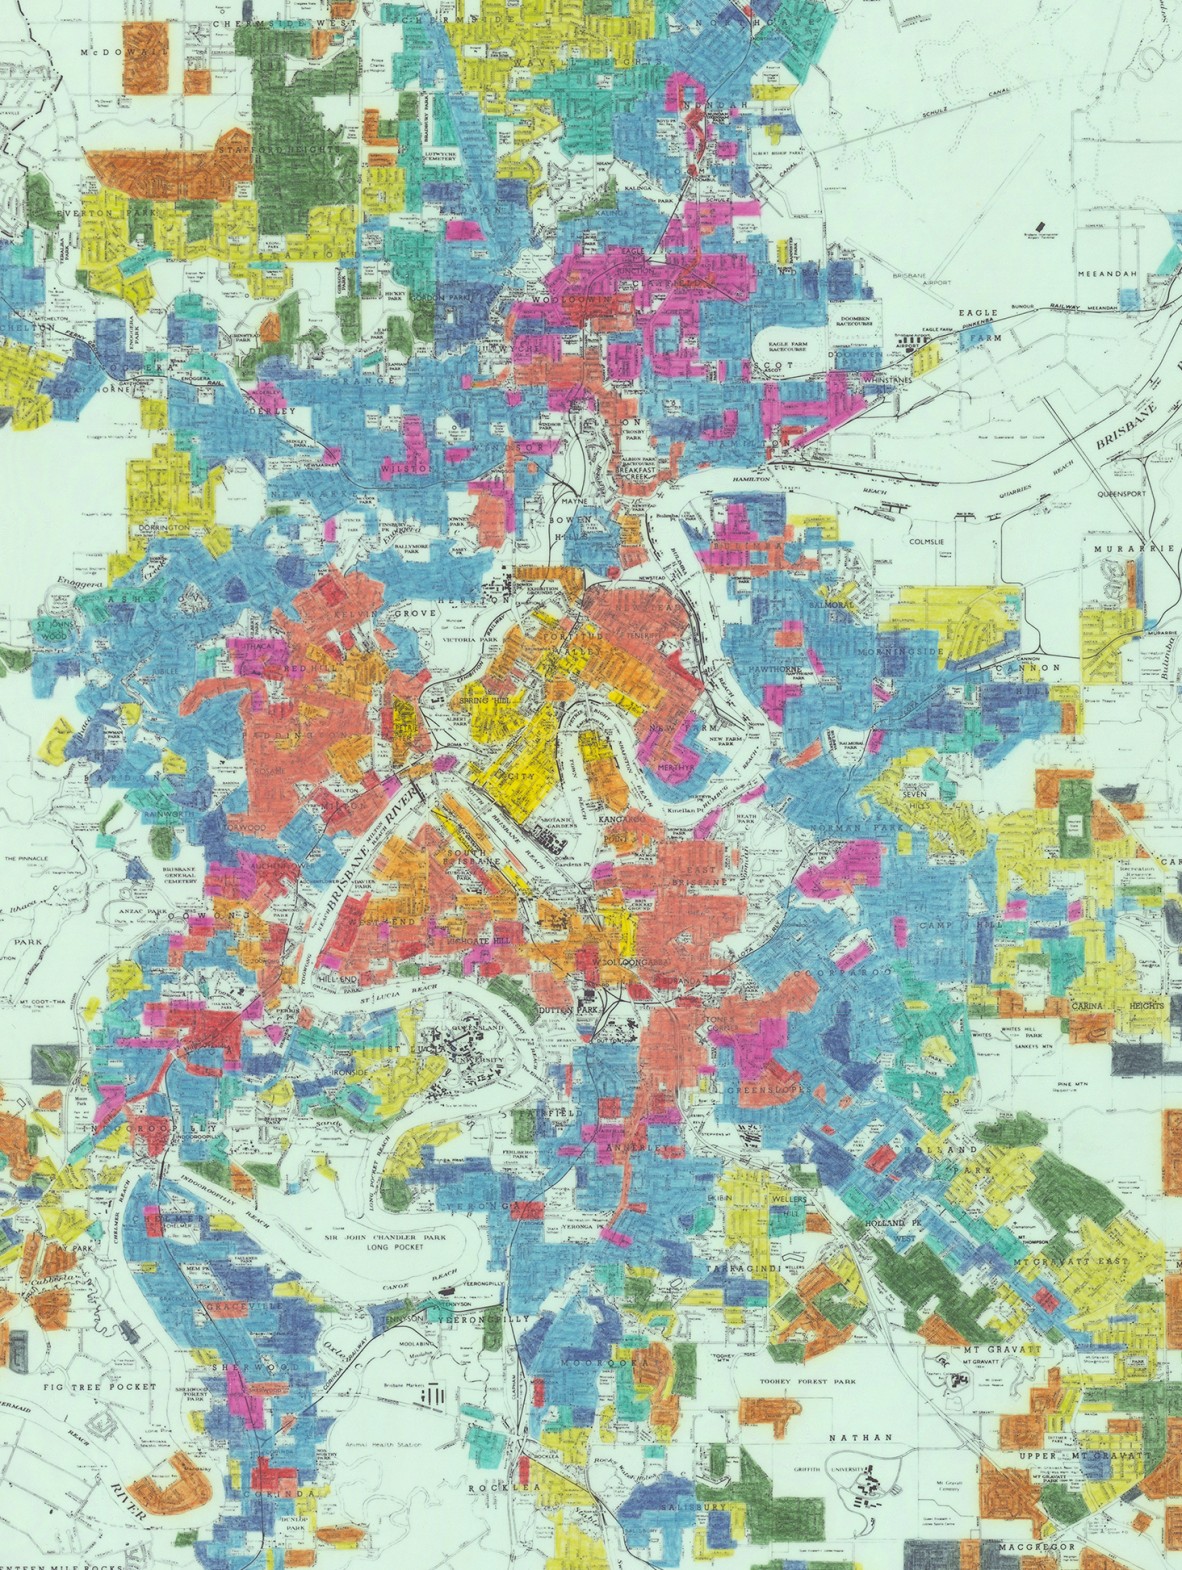
Close zoom on 'Map of Brisbane and suburbs, 1918' ; https://hdl.handle.net/10462/deriv/18677
It is fascinating and confronting to realise that today almost anyone can view, in person or online, literally thousands of distinct maps of Australia. In the not too distant past, only the powerful and highly enfranchised could create or access cartographic maps of place. The combination of mass digitisation, open access and modern computational technologies make this project possible, but those enabling factors must be placed in a broader, biased and complicated context. Which objects are considered collectable and by whom? Who decides what is made open access? How will these born digital maps be collected and archived? And what even is catalogued as a “map”? My collection-based residency project obviously preferences the western cartographic tradition, there are no aural or painted maps for example. These factors focus, while limiting, its scope.
In my next post, I discuss the results of my conversations with urban designers, placemaking experts, historians, artists, academics and people of Brisbane, as well as the results of the project survey. I also outline my plan for an interactive web interface that you can use to explore the maps of Brisbane’s history and then create your own future vision for Brisbane.
About the author
Dr. Keir Winesmith is the inaugural Digital Collections Catalyst for 2020. He has worked at the intersection of digital, culture and place for the last two decades. Keir created and collaborated on immersive and interactive cultural experiences in Australia, the U.S. and Europe, and in 2018 was named in Fast Company's '100 Most Creative in Business' for his work in this area. He currently leads a small strategic design agency and is an Adjunct Professor at UNSW Art & Design.
State Library created the Digital Collections Catalyst initiative for developers and creatives to support innovative and creative uses of our digital collections and collections data. We are interested in highly creative and experimental ideas that bring together technology with cultural heritage to inspire Queenslanders through State Library collections. Learn more about the Digital Collection Catalyst initiative here.
Comments
Your email address will not be published.
We welcome relevant, respectful comments.