- Home
- Making Maps with Machines
/
Making Maps with Machines
In early 2020, the State Library of Queensland put out a call for innovative and creative uses of our collections through a new initiative - the Digital Collections Catalyst in Residence. Dr. Keir Winesmith was successful with his proposal to use State Library's historic map collections to create machine learning models that visualise different possible futures for the city.
By Dr. Keir Winesmith, Digital Collections Catalyst 2020
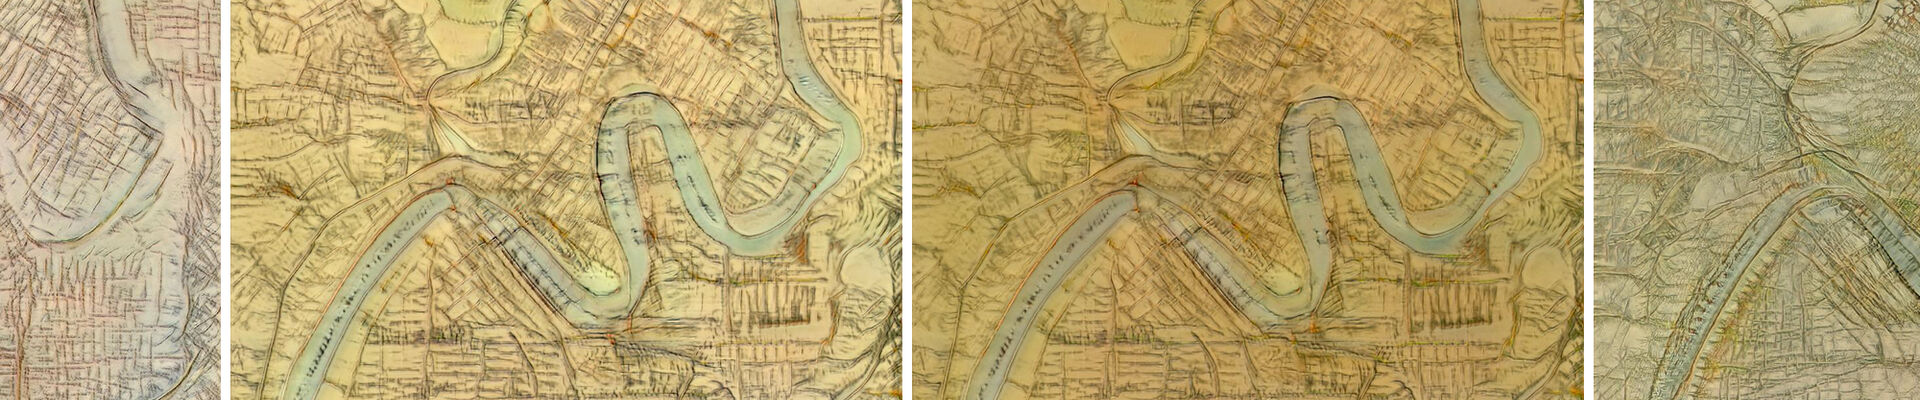
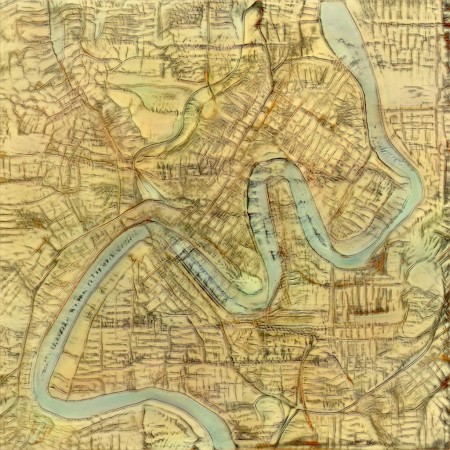
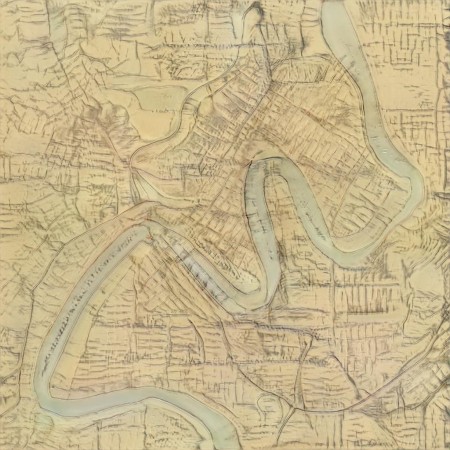
Above are a set of impossible and strange maps of Brisbane that were generated by a machine. As part of Mapping Future Brisbane I set out to create machine learning models that could produce their own maps of Brisbane and Queensland. These experiments are a key part of the project, and one of the most complex technologies used in the project’s development.
In the below article I explain how maps were selected and edited, how they are used to train a machine learning model and how the model was used to create map-like images and videos. There are also links to the models and outputs for those who are interested in building on this work.
Machine learning and Mapping Future Brisbane
The machine learning variants of artificial intelligence used here require a lot of training data. I use the term artificial intelligence hesitantly here, as these systems are better thought of intricate algorithms, built on real world inputs with a dash of randomness - they are not intelligent as we understand the word. Put another way, the term 'machine learning' stands in for a range of predictive computational methods which use existing data to generate new, unique outputs that can be used to train the model in order to improve further outputs. For this project, the first input “data” used are maps of Brisbane.
Although it’s tempting to think that the computer or the model is simply creating these images objectively, every step in the process described below includes human agency and decision making. For example, I selected the model, selected and cropped the input images, and set the training duration and variability. And I chose the output images and videos that are included here from thousands of possible examples. Machine learning sounds a bit like computational magic, however, it is really a set of deeply human, cultural and intentional processes aided by powerful computers and clever algorithms. Especially as this project builds upon early colonial cartographic maps, themselves culturally loaded and complicated objects.
Step 1: Find and select maps
The State Library of Queensland has hundreds of maps of Brisbane from the 1800s to the recent past. They range from large map series that are captured across time, to detailed folded editions for tram routes that no longer run. Beyond the Library, there are maps in Queensland’s Museum of Lands, Mapping and Surveying; Qld State Archives; State Library of NSW; and the National Archives and National Library in Canberra.
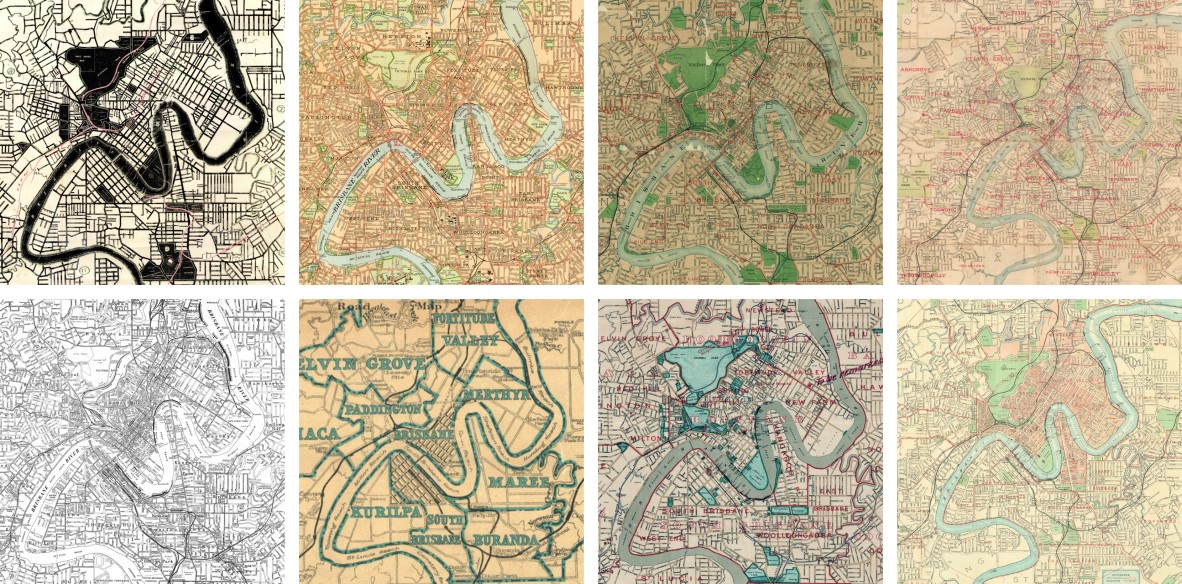
Although there are thousands of maps across these organisations, the vast majority aren’t suitable for this project. Some are too detailed (showing just one suburb or block, real estate maps for example) or not detailed enough (showing the whole of South East Queensland or the whole state). Many from the 1800s only show Brisbane as it was then, understandably, however the area I’m looking to recreate extends well beyond the city’s early colonial boundaries. Others still were designed to document specific events, such as the 1893 flood. After a lot of searching and vetting, I was limited to less than 100 maps that showed the area I was interested in and could be productively fed into the machine learning model. These maps are beautiful and incredibly diverse.
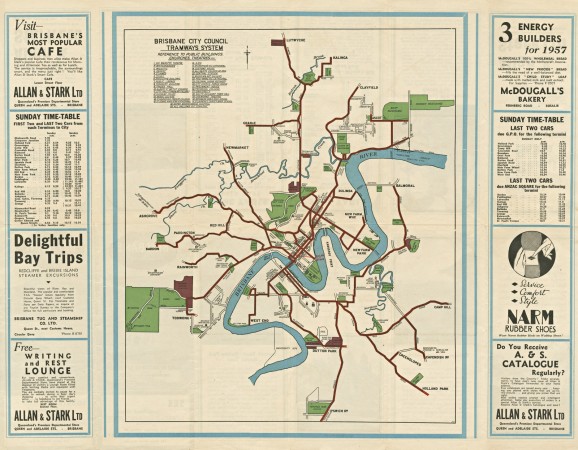
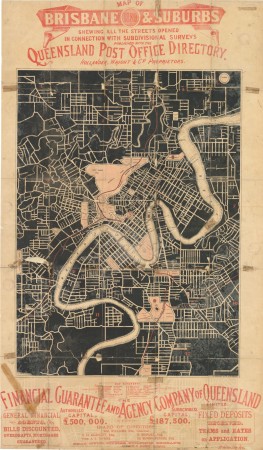
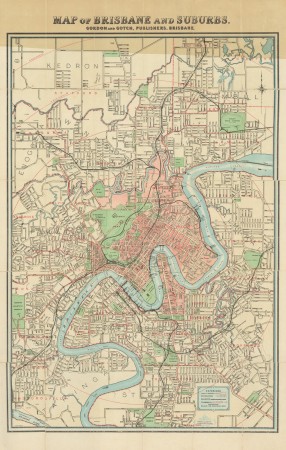
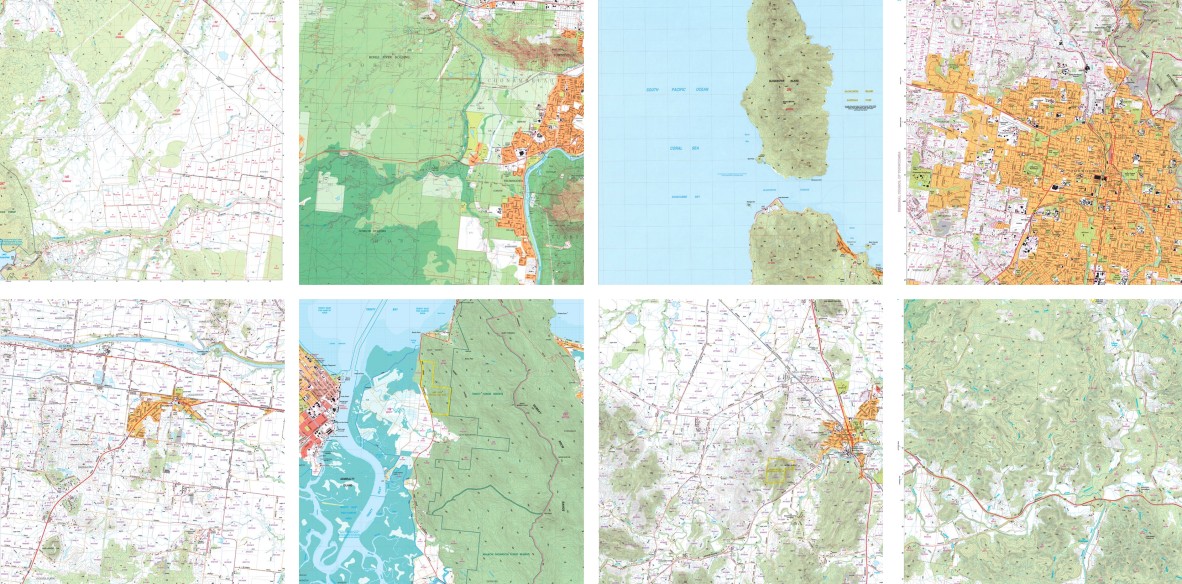
Once the maps were selected I cropped them into a shape that is clearly understandable as Brisbane, with its iconic river running through the middle of the frame. I used a custom built image manipulation tool developed by AX Interactive, as they have a long history of creating interactive experiences for the GLAM sector that include machine learning elements.
This tool allowed me to align the river across the different map images, and to create consistently aligned and sized images like those below.
Step 2: Train the model
These images were then used to train a StyleGAN (version 2) model. StyleGAN is a type of Generative Adversarial Network (GAN) which can be used to generate medium and high quality photo-realistic images. It was developed, and subsequently improved, by the boffins at the computer graphics technology company NVIDIA. It is truly remarkable math, and well worth exploring if you are a big nerd like me. Most of my previous machine learning experience is with text, rather than images, so it was great to have an opportunity to explore these systems in a practical way. Most famously, StyleGAN’s have been used to generate realistic looking pictures of human faces, for example This Person Does Not Exist.
This selection of maps didn’t have the same diversity as the human face, however I wanted and expected the output to be tight variations on Brisbane’s topography. I started by only training the model for a limited number of steps. Think of training steps as the number of times you’ve heard a song. With each repetition, you will get better at remembering the song, or humming it’s tune. With machine learning, each step means the model is better at predicting what will happen next, or generating outputs that more closely match the input.
In this video you can see the Brisbane river running through the middle of the frame, and the grids of streets, railways and parks morphing and warping. This animation is called a latent space walk, which is machine learning jargon for generating visual transitions between randomly selected predictive map outputs from the model.
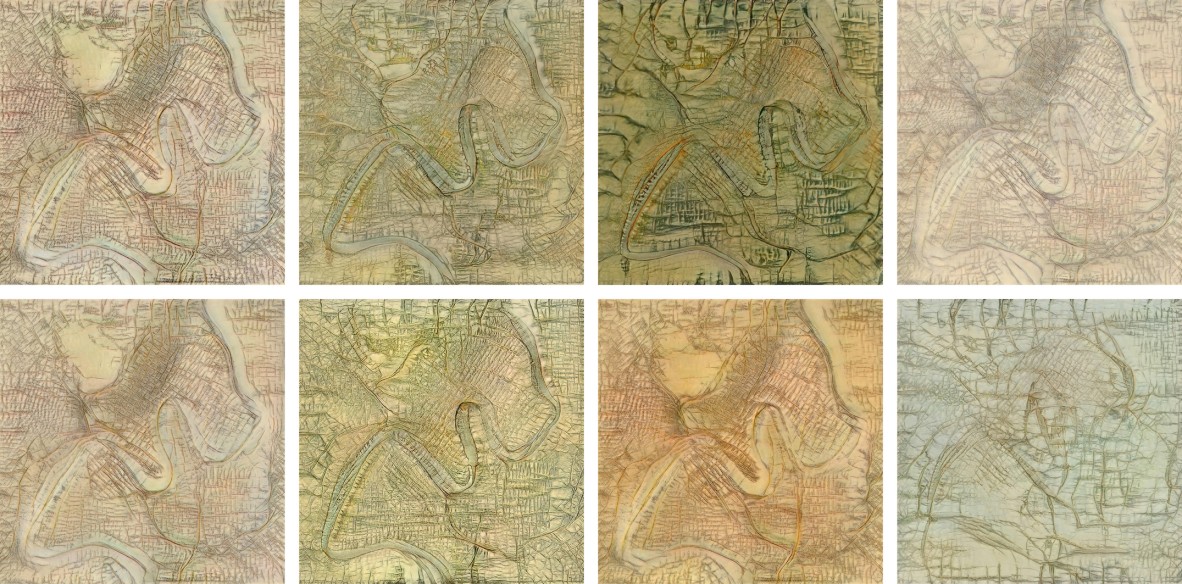
Because most of the maps, especially those from the 1800s and early 1900s, are black and white, or black and yellow-y off white, you can see that the vibrant colours of more recent maps were drowned out. Below are a few images created by the model, including one (bottom right) that isn’t really very Brisbane-y. This illustrates the variety of outputs such a model can create.
Step 3: Improve the model
To improve the output, the model was trained over an additional 3,000 steps and the addition of extra map images in which the blue of the river was colour “corrected” to be more pronounced. This created a model that was more obviously Brisbane, with less variation between the generated images.
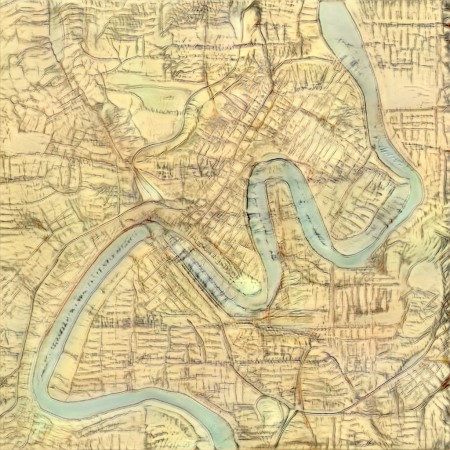
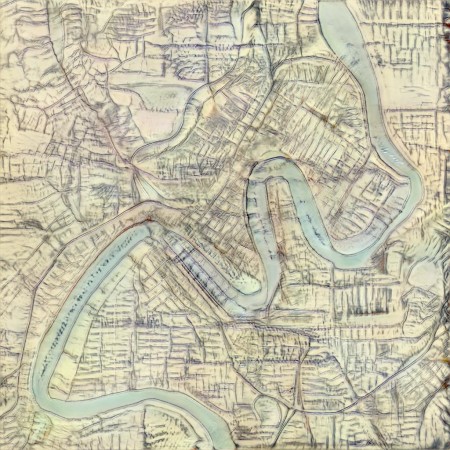
After about 4 hours of training across two sessions, I now have a GAN model that can be used to generate map images that adhere to the elements of Brisbane’s topography and urban development that are encoded into these wonderful old maps from the State Library of Queensland and other archival sources. To continue the open access approach, the models have been added to the State Library collection so you and anyone else can download them and use them. We’ve also posted the model publically on the RunwayML platform which allows users to retrain, export from or use in other ways without requiring computer programming experience or tools usually required for this work. In addition, the Library has accessioned a series of maps generated by the model into their collection which means these will soon be available to all through the Library’s catalogue.
With this phase of the exploration complete, I went in search of a larger corpus of maps that were more visually diverse, but still focused on Queensland.
Generative Queensland Maps
During my research for Mapping Future Brisbane, I spoke with staff at the state government’s Museum of Lands, Mapping and Surveying. Kaye Nardella sent me an amazing number of mapping resources, including a series of open data references to topographic maps of Queensland. One group included open source maps from 1965 to 2012. There are over 700 map scans and I think they’re beautiful but, as you’ve probably realised by now, I really love maps.
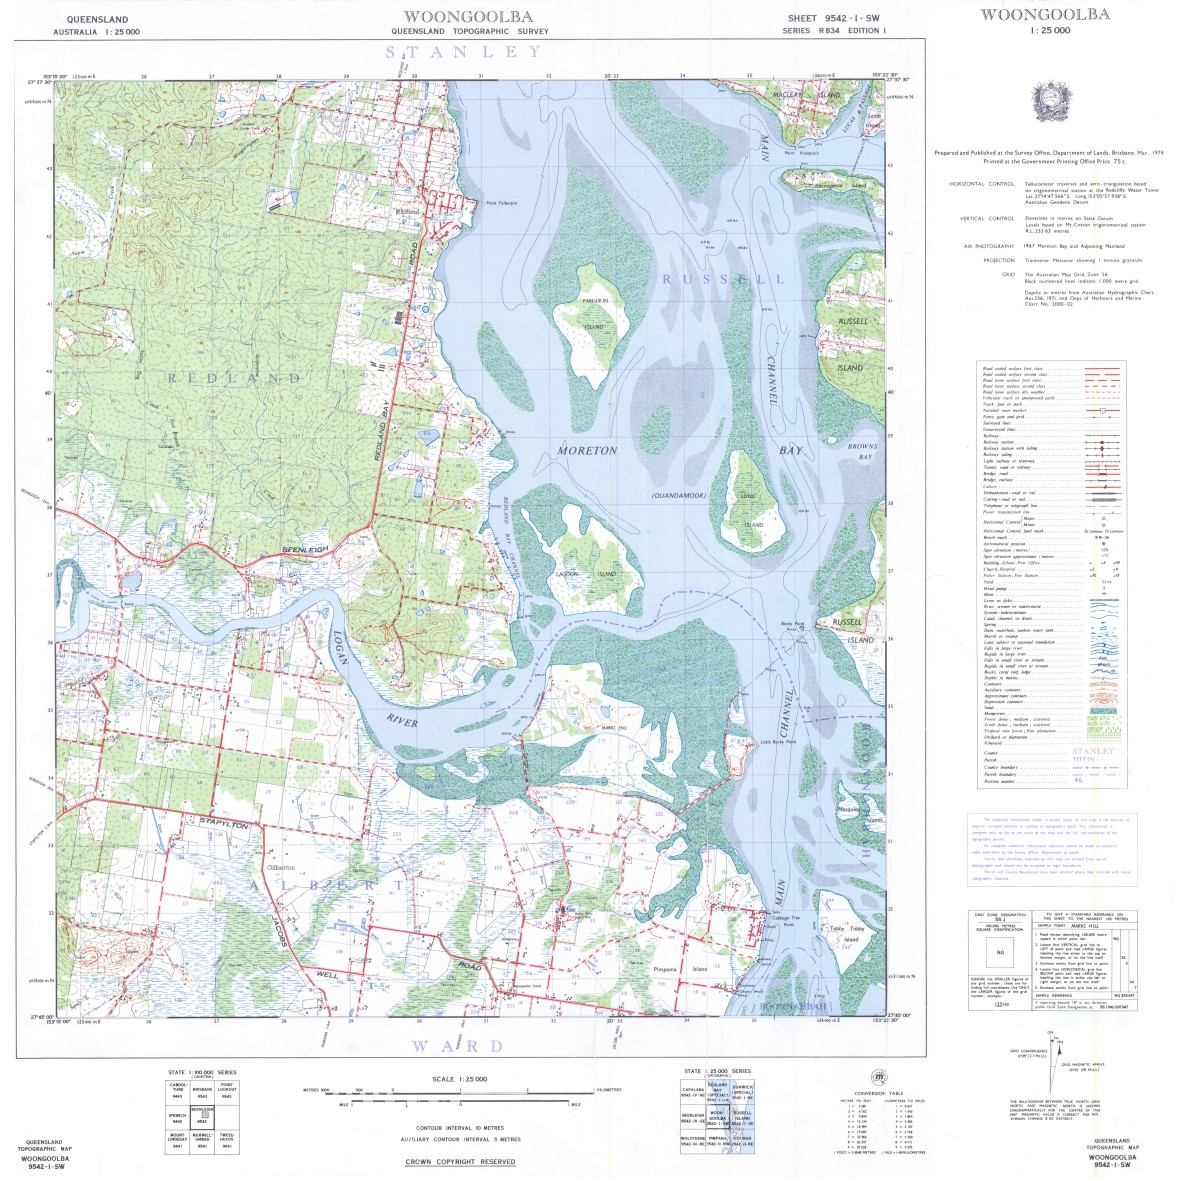
I downloaded them all using a command line tool (called wget), and cropped out the map part of the image using an automated image manipulation tool (Imagemagick's crop function). I used slightly different settings for the cover maps, as these are scans of actual printed objects where the position of the map part of the image changes for each map type. This yielded approximately 700 usable maps. Ideally, you need more than 1,000 for a good training data set. As such, I made a copy of each map and rotated the copies 180 degrees to double the number of map images. This worked well, as flipped topographic maps still look exactly like maps, unlike faces or shoes or buildings. I could have also rotated the original set by 90 and 270 degrees, as the images are square, however the training set was now at 1 Gig and almost 1,500 maps, which was sufficient for my experiment.
Building new StyleGAN models off existing ones brings many efficiencies. Training a model from scratch can take dozens or even hundreds of hours. Starting with a pre-trained model based on open access illustrations from the Biodiversity Heritage Library, I trained my model with the Queensland maps for 3,000 steps. Watch as the model learns and transforms from illustrations to maps.
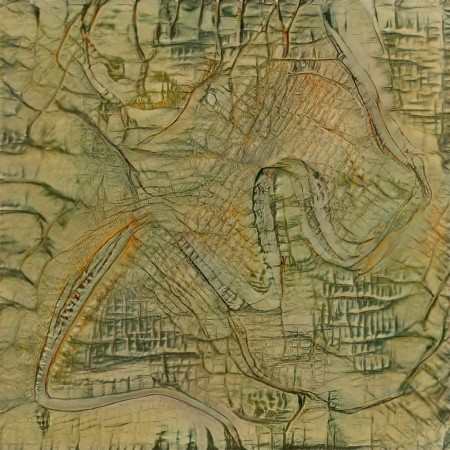
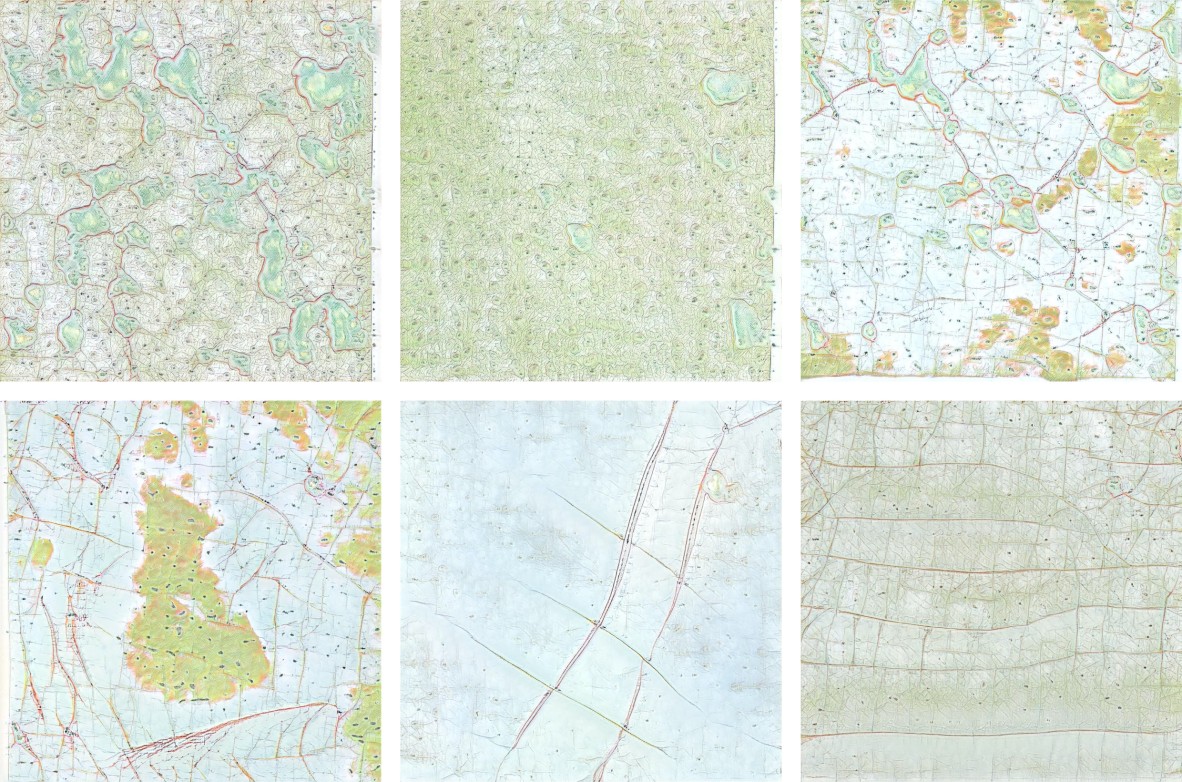
The model was then able to generate artificial maps of Queensland. I think these are great, however they’re not where I want the model to be. The map images are too repetitive and gridded, and they often include small bulbous elements that are archetypal of this machine learning method.
To improve the model, I trained it for another 3,000 steps and was, happily, able to achieve the sort of strange, dream-like maps of Queensland I was looking for. Whether it’s inland, with roads snaking across a landscape of mountains, forests, open fields, lakes and small townships.
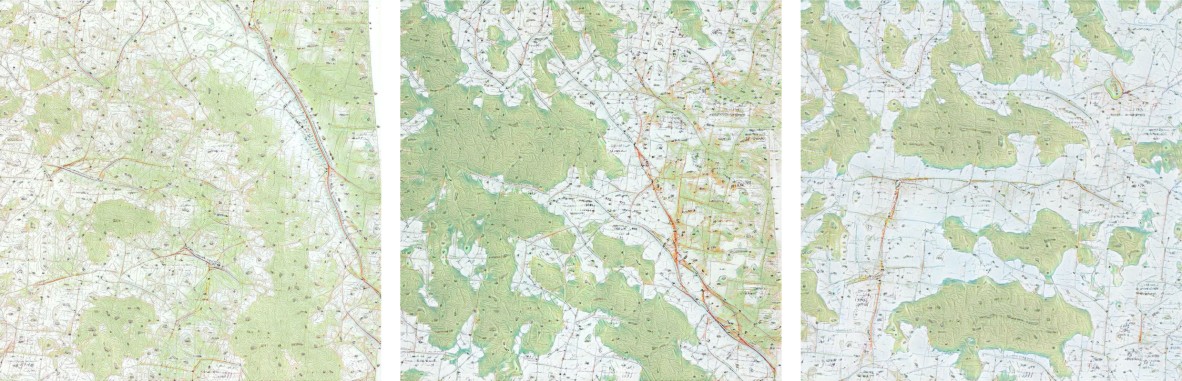
Or along the coast.
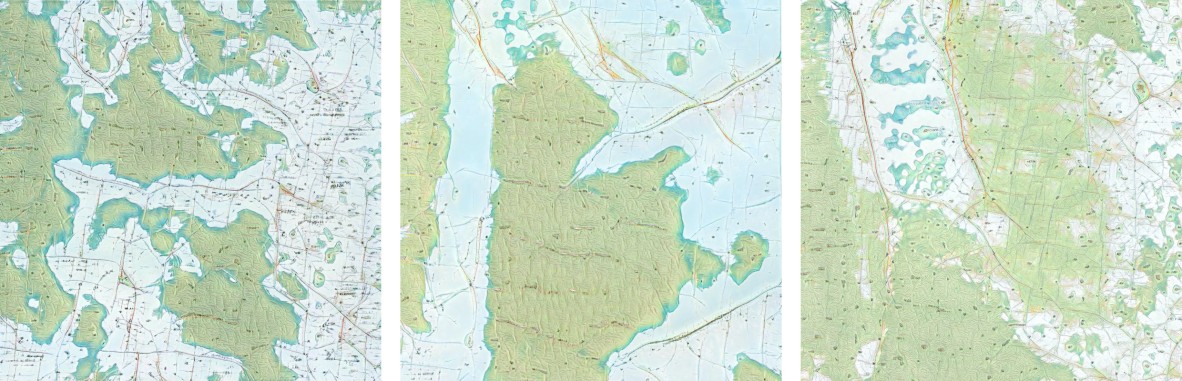
The model used to create these images and videos has been accessioned by the State Library and will soon be available for download. If you would like to try this yourself, here is the Queensland Maps StyleGAN model on the excellent RunwayML machine learning platform that supports machine learning experimentation by non-programmers.
The Final Maps
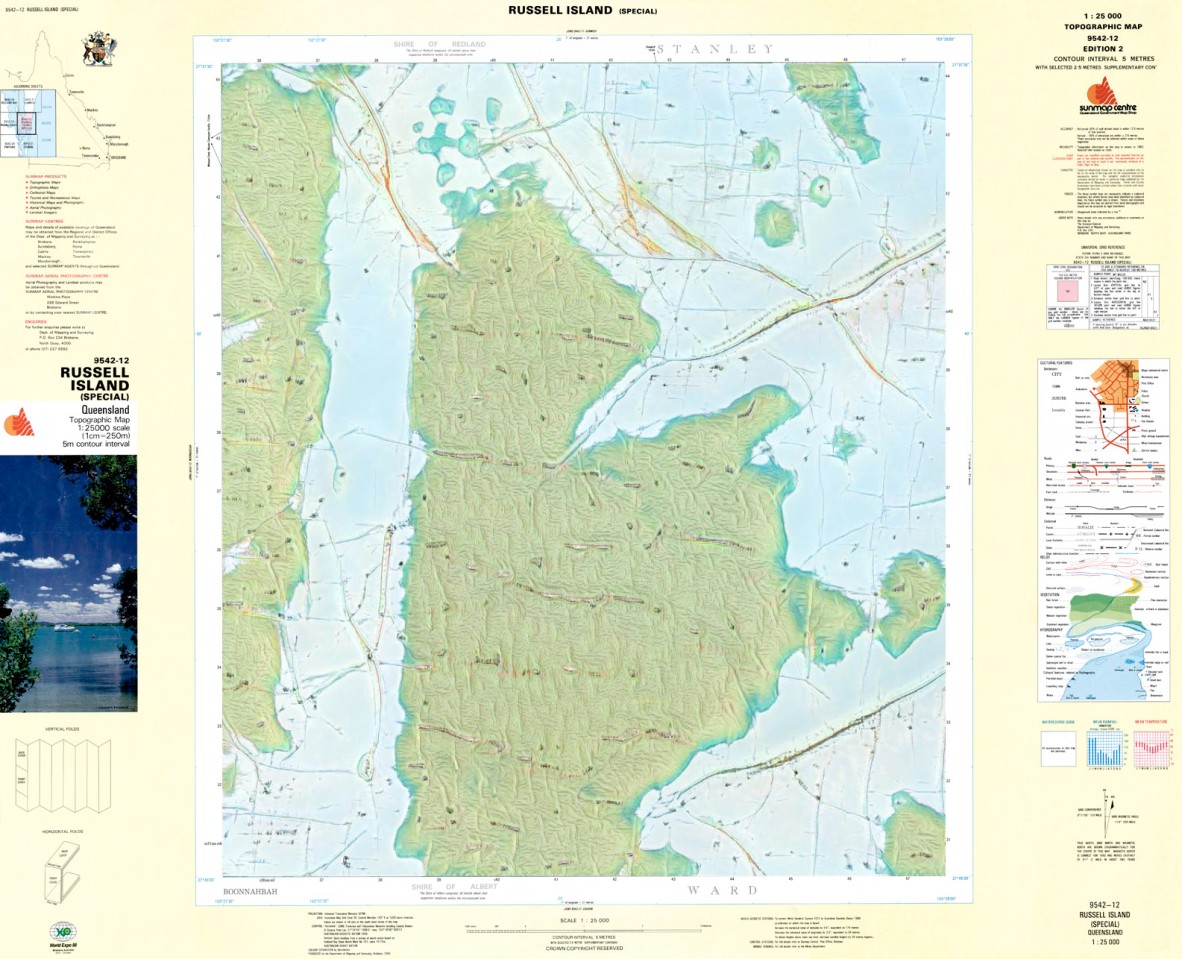
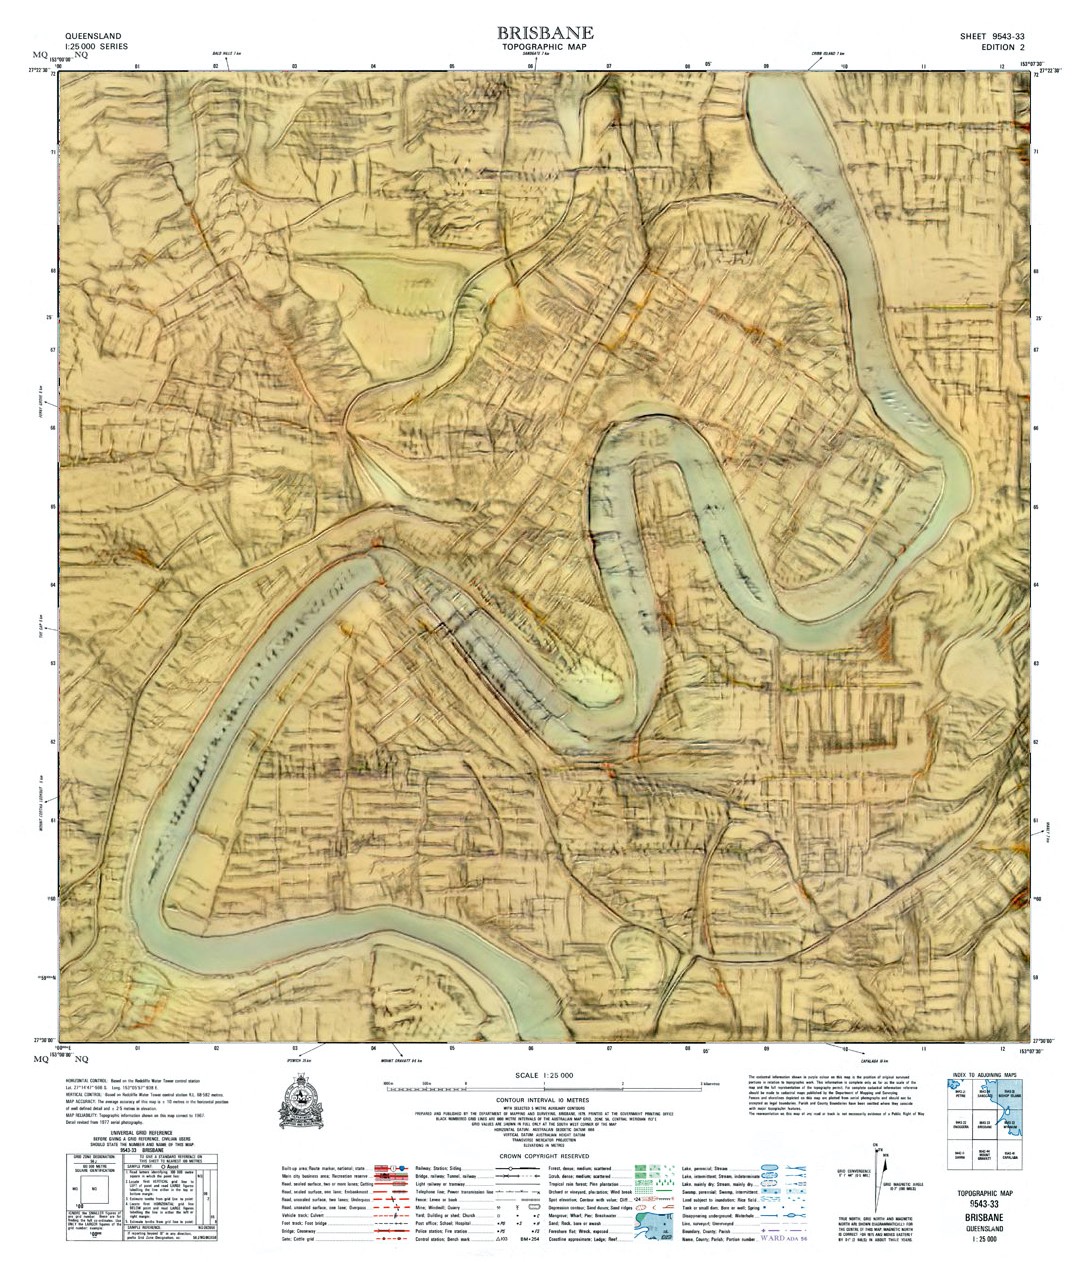
Finally, to return the original objects of inspiration, here are a few of my favourite machine generated maps embedded back into the source “data” created by the Office of the Surveyor General.
Below is what Russell Island might look like if it was created by a machine that thinks roads belong in the ocean.
Or Brisbane, in an alternate universe.
If you would like to better understand how machine learning can and should be applied in libraries, I encourage you to look at the Responsible Operations: Data Science, Machine Learning, and AI in Libraries report from the OCLC in the U.S., or join up to the AI4LAM Australia & New Zealand group closer to home.
Next: Old Windmill Tower
About the Digital Collections Catalyst
- Dr. Keir Winesmith is the inaugural Digital Collections Catalyst for 2020. He has worked at the intersection of digital, culture and place for the last two decades. Keir created and collaborated on immersive and interactive cultural experiences in Australia, the U.S. and Europe, and in 2018 was named in Fast Company's '100 Most Creative in Business' for his work in this area. He currently leads a small strategic design agency and is an Adjunct Professor at UNSW Art & Design.
- State Library created the Digital Collections Catalyst initiative for developers and creatives to support innovative and creative uses of our digital collections and collections data. We are interested in highly creative and experimental ideas that bring together technology with cultural heritage to inspire Queenslanders through State Library collections. Learn more about the Digital Collection Catalyst initiative here.