Maps: More than just finding your way
By Ellen Newcombe, Librarian, Library and Client Services | 16 January 2024
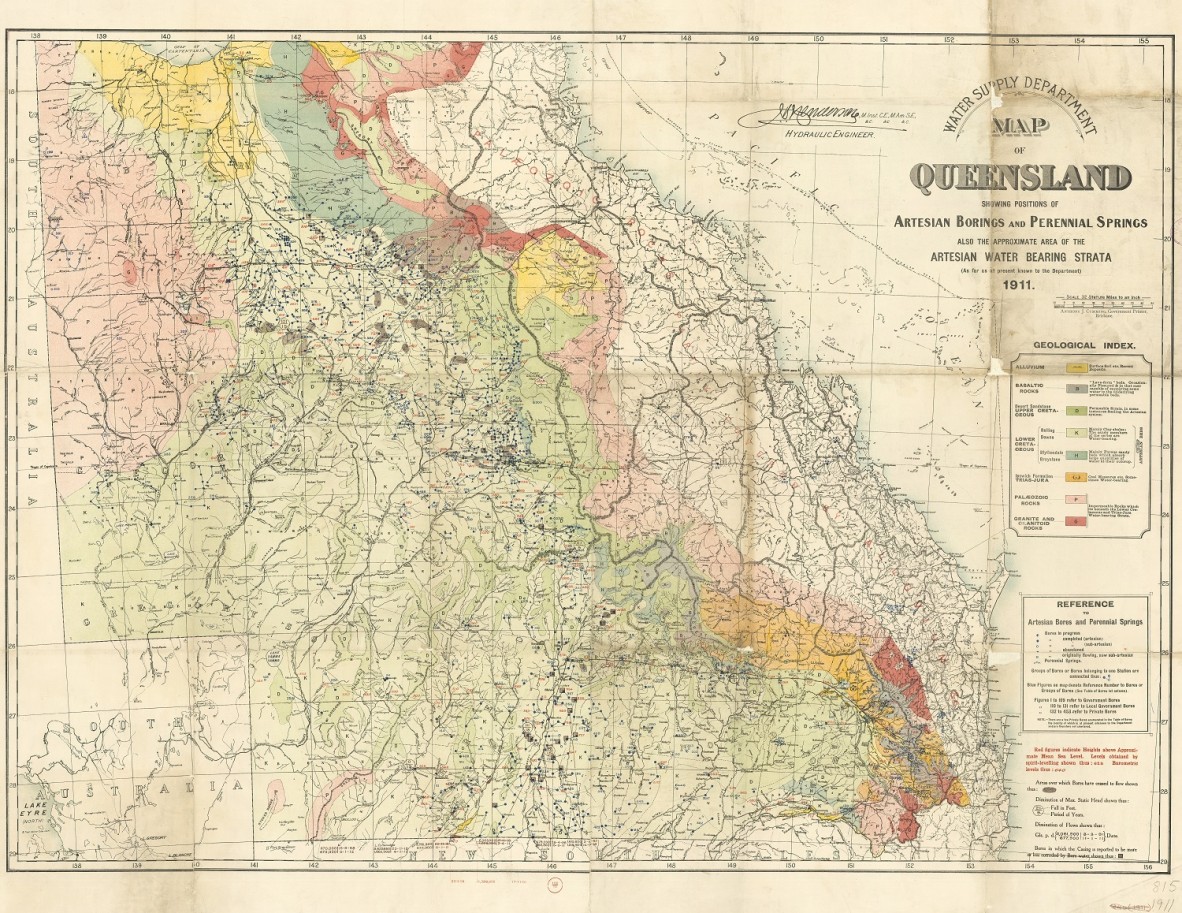
Map of Queensland, showing positions of artesian bores and perennial springs also the approximate area of the artesian water bearing strata. 1911. https://hdl.handle.net/10462/mapstd/1425370
It’s easy to think of maps primarily as a tool for navigation but they can be a great resource for family and local history research.
State Library has a vast collection of heritage maps that can help enrich your research. Beyond cadastral maps and topographic maps, State Library’s collection includes geological surveys, mining lease maps, aeronautical and hydrographic charts, and tourist maps. If you’re doing family or local history research, there’s probably a map that can help you out. Some of the ways maps might add to your research could include:
- understanding the layout of a location at a given point in time and how it may have changed;
- clues about what life in a particular place might have been like;
- the exact location of a home, workplace or property;
- historical land use.
A town or locality at a given point in time and how it may have changed
Maps can act like a window into the past. They can serve as a point of connection between a physical place in the present and what that very same place may have been in the past. Somewhere as mundane and familiar to us as an airport might once have been predominantly swampy mangrove and then the, now former, suburb of Cribb Island.
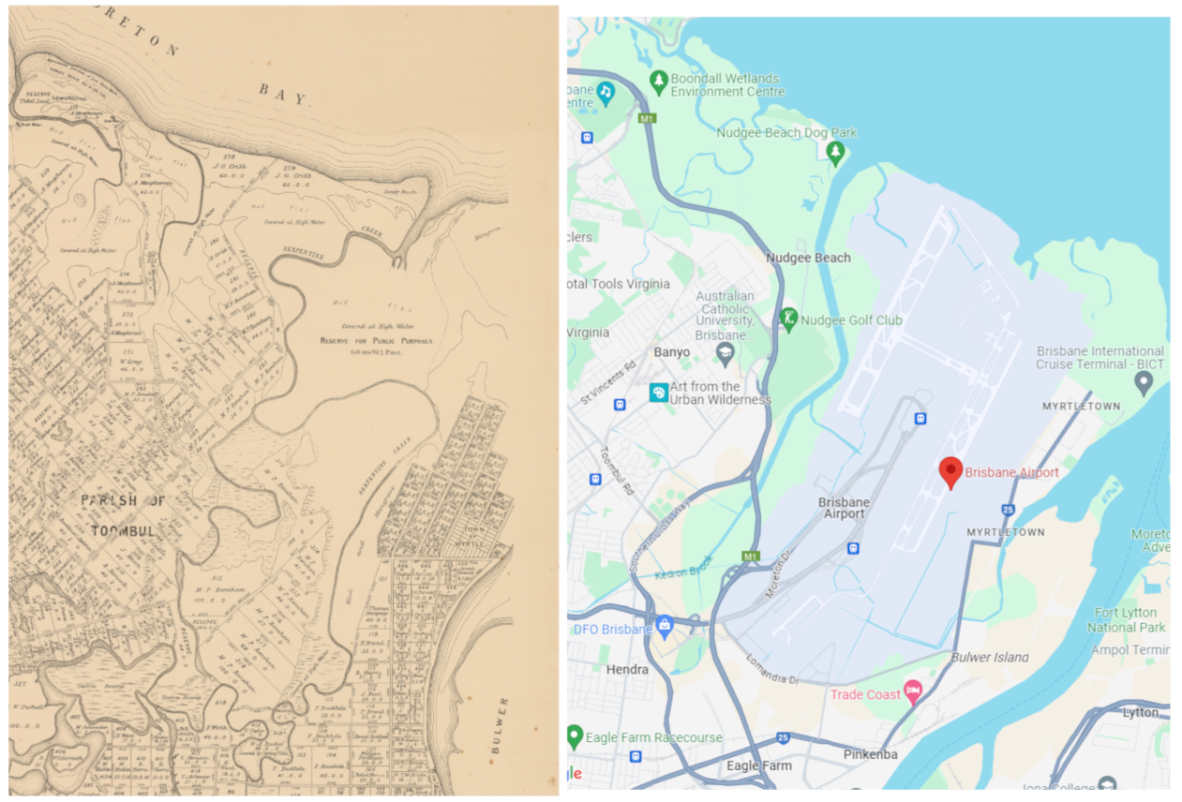
[Moreton 20 chain map series]: Sheet 8C, Parish of Toombul, 1885. John Oxley Library, State Library of Queensland http://hdl.handle.net/10462/deriv/253003
Brisbane Airport, Google Maps, viewed 25 November 2023
The Moreton 20 chain map is a series of cadastral maps published between 1863-1893. They give a detailed view of Southeast Queensland including Brisbane. They show cities, towns, parishes, roads, streets, railways, rivers, creeks, parks, reserves, property boundaries and some landowners' names. Sheet 8C, the Parish of Toombul, shows the area that is now Brisbane Airport and describes it as mud flats and mangroves. Also marked along the bay between Nudgee Beach and Sandy Beach is the name of the landowner, JG Cribb, who would give his name to the suburb of Cribb Island.
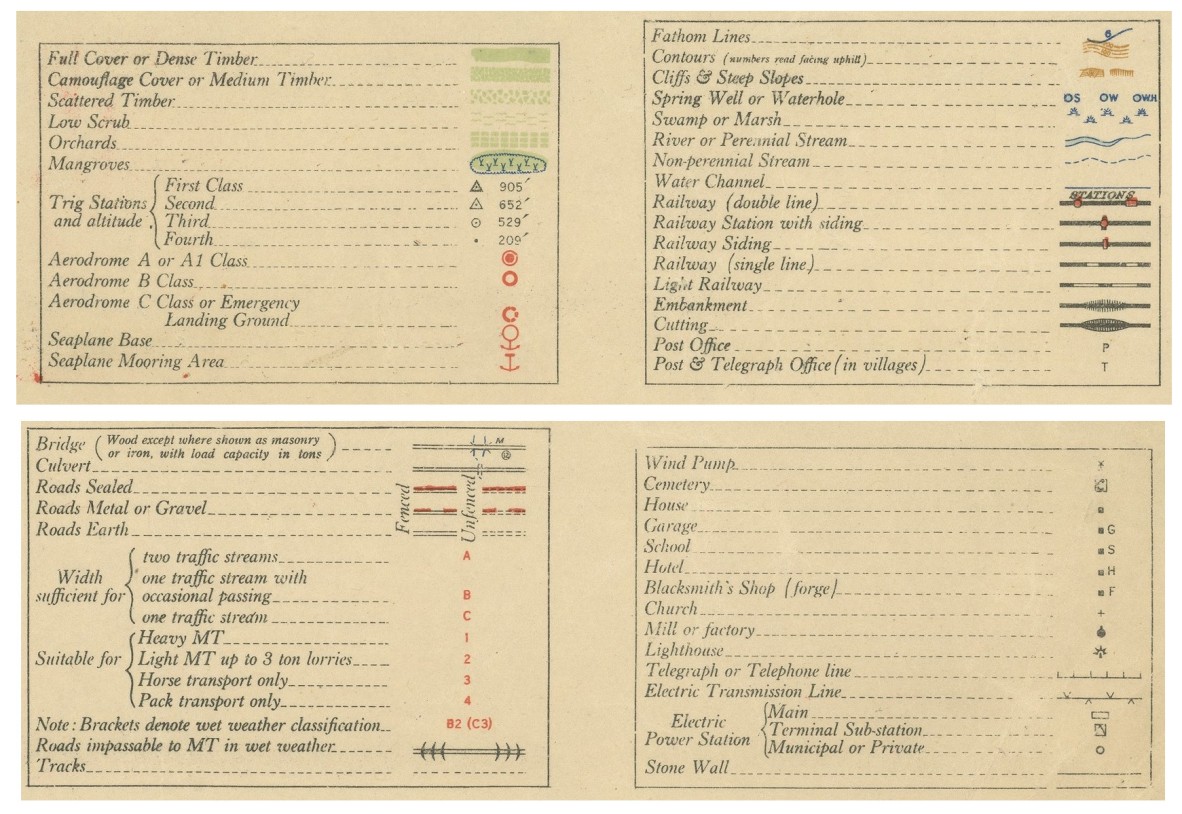
Detail of key from sheet showing Maroochydore. Australia 1:63,360 [Military survey of Australia : Queensland] / prepared by Australian Section Imperial General Staff. John Oxley Library, State Library of Queensland. http://hdl.handle.net/10462/deriv/252963
Topographic maps indicate natural features such as terrain, vegetation, waterways, and contours. They also show constructed features like roads, bridges, railways, and various types of buildings. The key above comes from the Australia military one mile series. Need to know where there was a blacksmith’s shop near Maroochydore? You may find an answer on a military topographic map. Topographic maps may also indicate crops, for example, the map of Maroochydore from the Australian military one mile series indicates where crops such as bananas and sugar cane were grown.
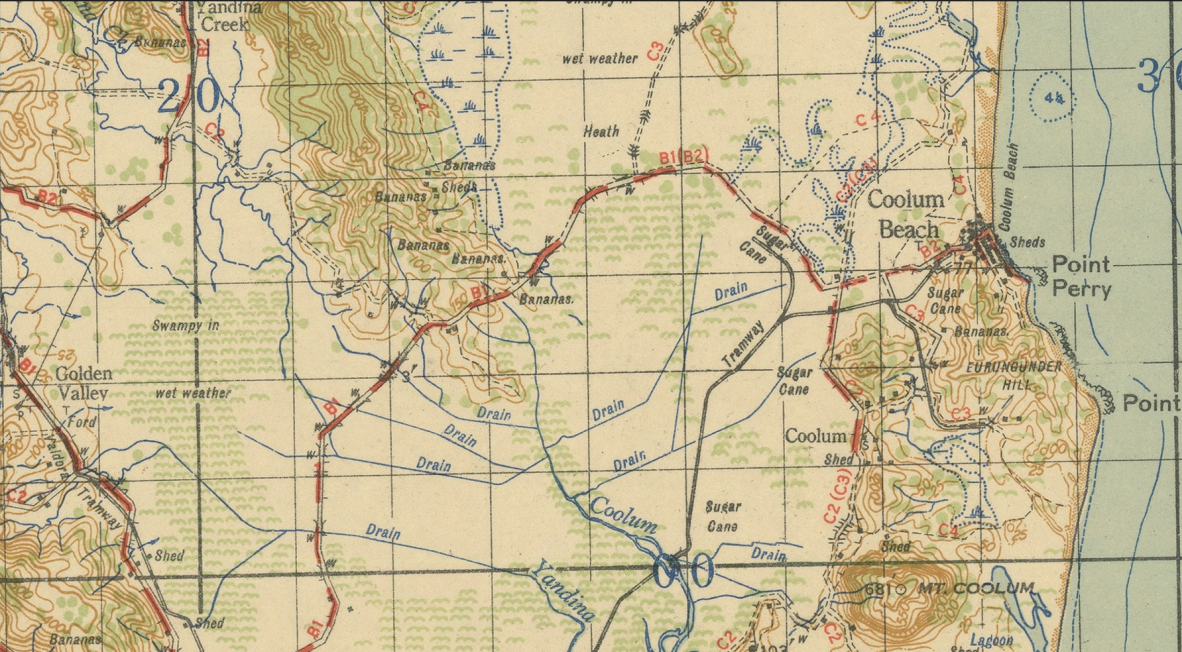
Detail from sheet showing Maroochydore. Australia 1:63,360 [Military survey of Australia : Queensland] / prepared by Australian Section Imperial General Staff. John Oxley Library, State Library of Queensland. http://hdl.handle.net/10462/deriv/252963
Clues about what life might have been like
Tourist maps show you how to get around. They can include public transport routes and timetables, major roads and highways, and the locations of service stations but they can also include advertisements for businesses and attractions. Tourist maps can tell us how people may have spent their leisure time. This map of the Brisbane tramlines, issued in 1957 by the Brisbane City Council lists the tram timetable as well as the locations of public buildings like the General Post Office and Public Library, churches, and theatres. Along with ads for cafes, boat trips on the bay and department stores it also includes an ad for a free ‘writing and rest lounge’, a public space in the department store Allan & Stark in Brisbane City. This is described as a lounge room fitted with writing desks and telephones where customers are invited to pause during a busy day of shopping, write a letter, or make a telephone call to a friend.
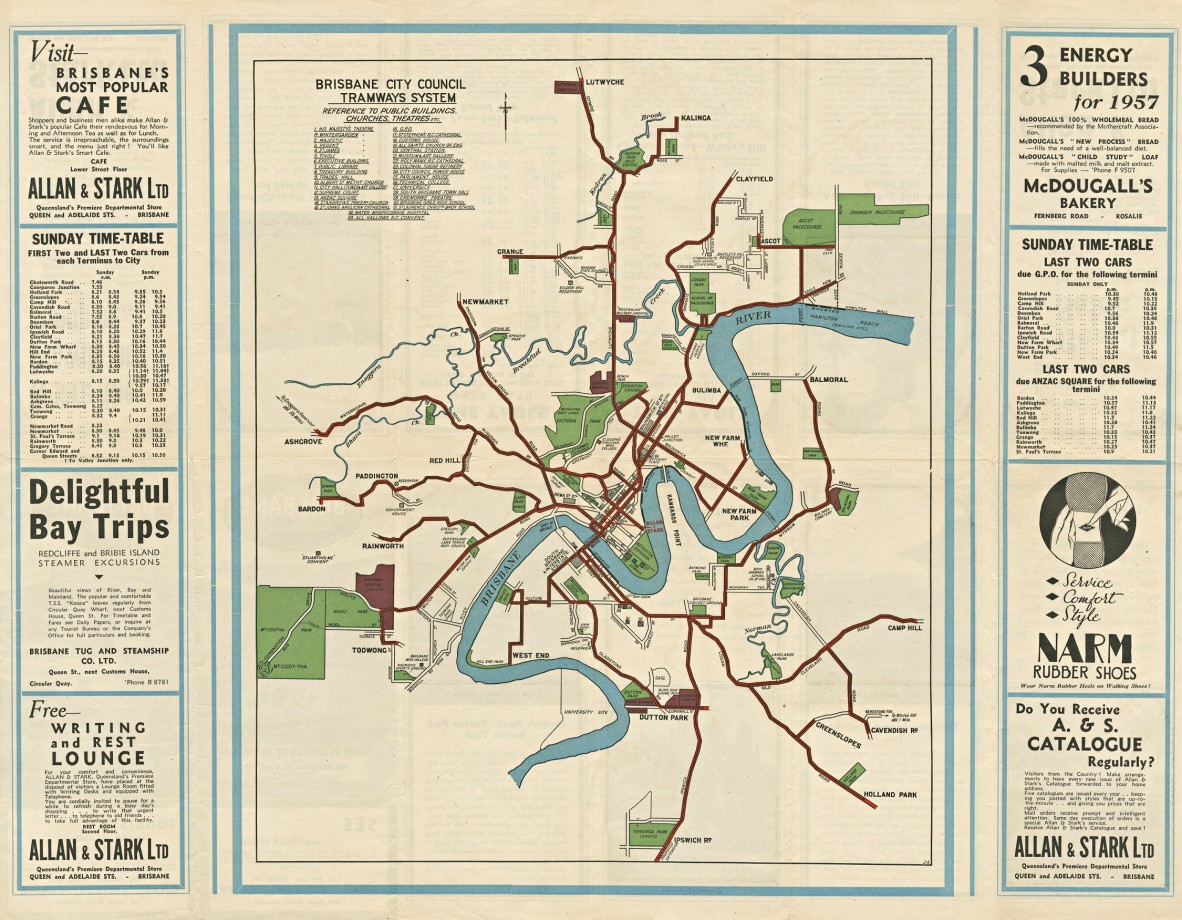
See Brisbane from the trams / issued by Brisbane City Council. 1957. John Oxley Library, State Library of Queensland. http://hdl.handle.net/10462/deriv/256358
Estate maps were created by real estate firms between the 1850s to the mid 1900s to advertise the sale of land. They can tell you about the subdivision of land, when land was first auctioned, who the surveyors were and who sold the land. They can be a useful tool for researching the history of urban areas. Created for the purpose of advertising they are also visually impactful, including artistic renderings of street maps, illustrations of local landmarks and views, and in some instances also photographs. The Bulcock Estate map below advertised land in Caloundra and in addition to selling land it’s also selling a particular lifestyle. The Bulcock Estate was a “sportsman’s paradise for fishing, surfing, and boating” and “the cream of the seaside resorts.”
As more land was subdivided over time and more estate maps produced to advertise that land you may be able to trace the changes in how a particular suburb or town was marketed. An earlier estate map from around 1884, also for land in Caloundra, includes illustrations of the beach and headland, giving a different impression of Caloundra at a time when it was less developed, less of a seaside resort and sportsman’s paradise and more of a natural idyll.
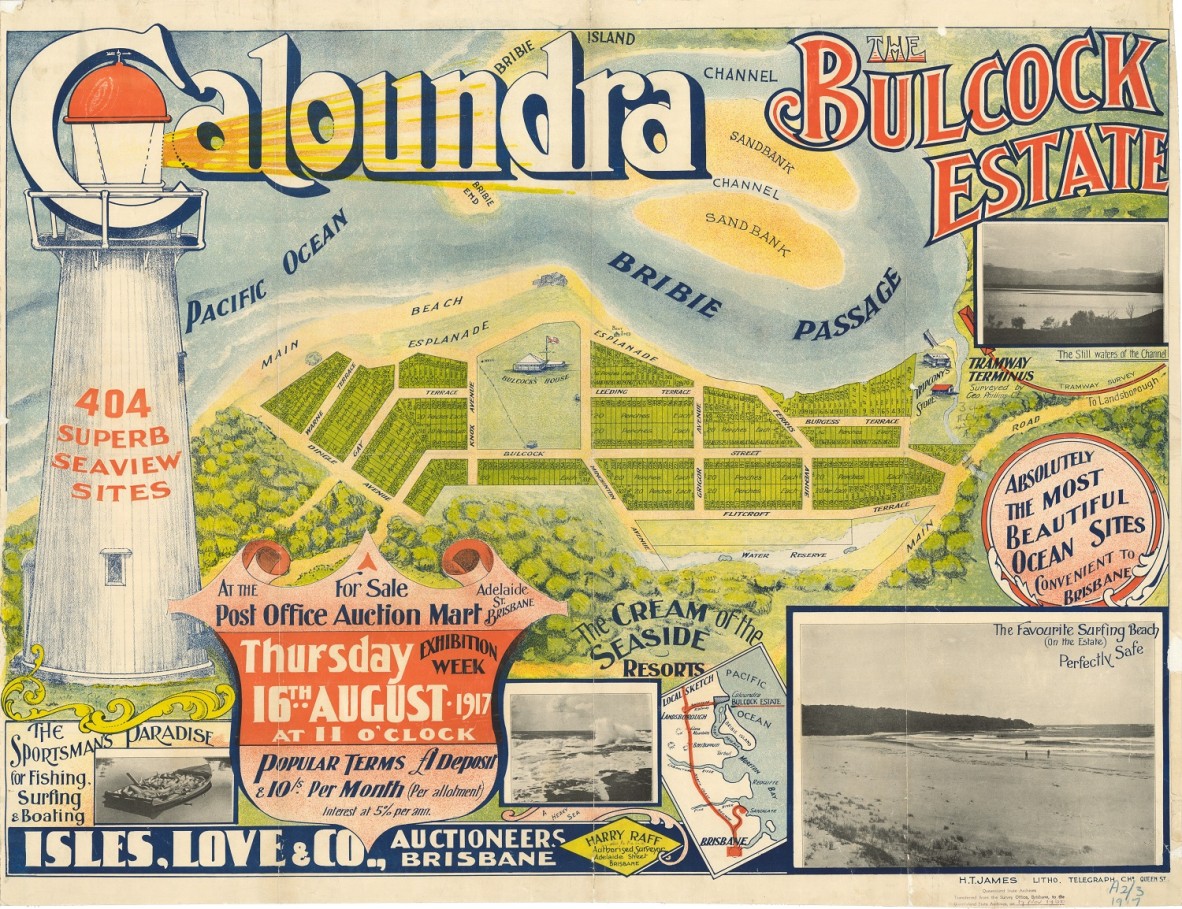
Bulcock Estate Caloundra / Isles, Love, Land Agents, 1917. John Oxley Library, State Library of Queensland. http://hdl.handle.net/10462/deriv/207315
The exact location of a home, workplace, or property
Town maps are a type of cadastral map that can provide useful historical information. Queensland town maps were published at a variety of scales, but they are usually quite detailed and can include property boundaries, property descriptions and, for those published earlier than the 1950s, details of land tenure. Below is a detail from a town map of Toowoomba from 1885 showing a single city block. It shows the names of the landowners, but also indicates the location of a church, a school, and a parsonage as well as land reserved for other purposes. Comparing it to a contemporary view from Google Maps you can see how the land has been subdivided, what has changed, and what remains the same. Queensland State Archives have put together a useful guide for researching land tenure.
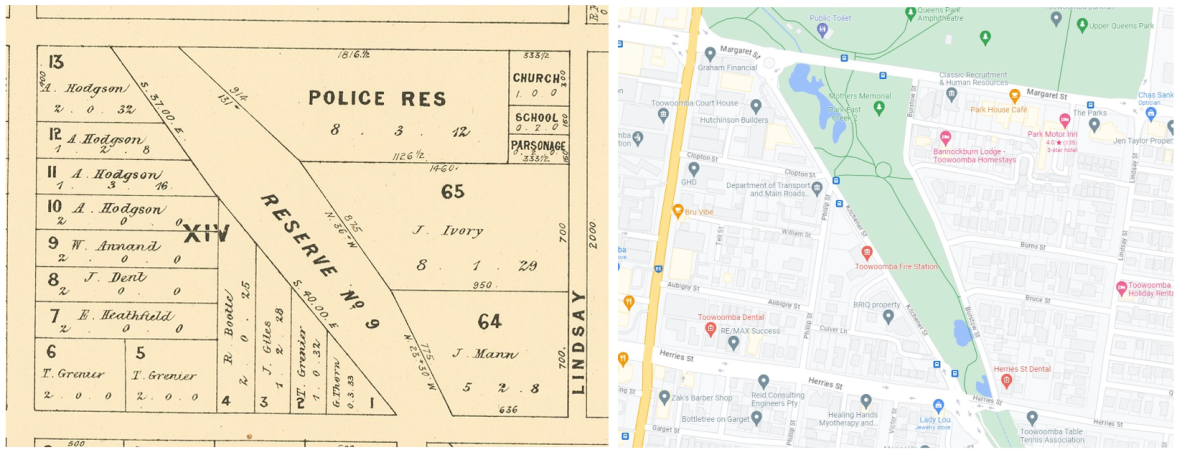
Town of Toowoomba, Queensland Surveyor-General's Office, 1885. John Oxley Library, State Library of Queensland. http://hdl.handle.net/10462/deriv/253052
Toowoomba, Google Maps, viewed 25 November 2023
Historical land use
Historical survey plans usually include lists of survey reference trees. Referred to as ‘blaze trees’ because of the way that they were marked by surveyors, these trees served as reference markers for land corners and boundaries. Methods used by surveyors to mark boundaries necessarily varied according to the type of country, in wooded areas trees served as useful boundary markers. The bark of the tree would be stripped back in a shield shape and then the exposed wood marked with an arrow, which indicated a government survey, and the portion number. Some of these survey trees still stand and are an important and tangible link to past land use. Many have been lost to fire, clearing, and natural death and decay. The lists provided on survey plans can provide important insight into historical biodiversity in cases where the trees no longer survive.
This survey of Caloundra from 1883 includes a long list of survey trees and indicates a variety of species.
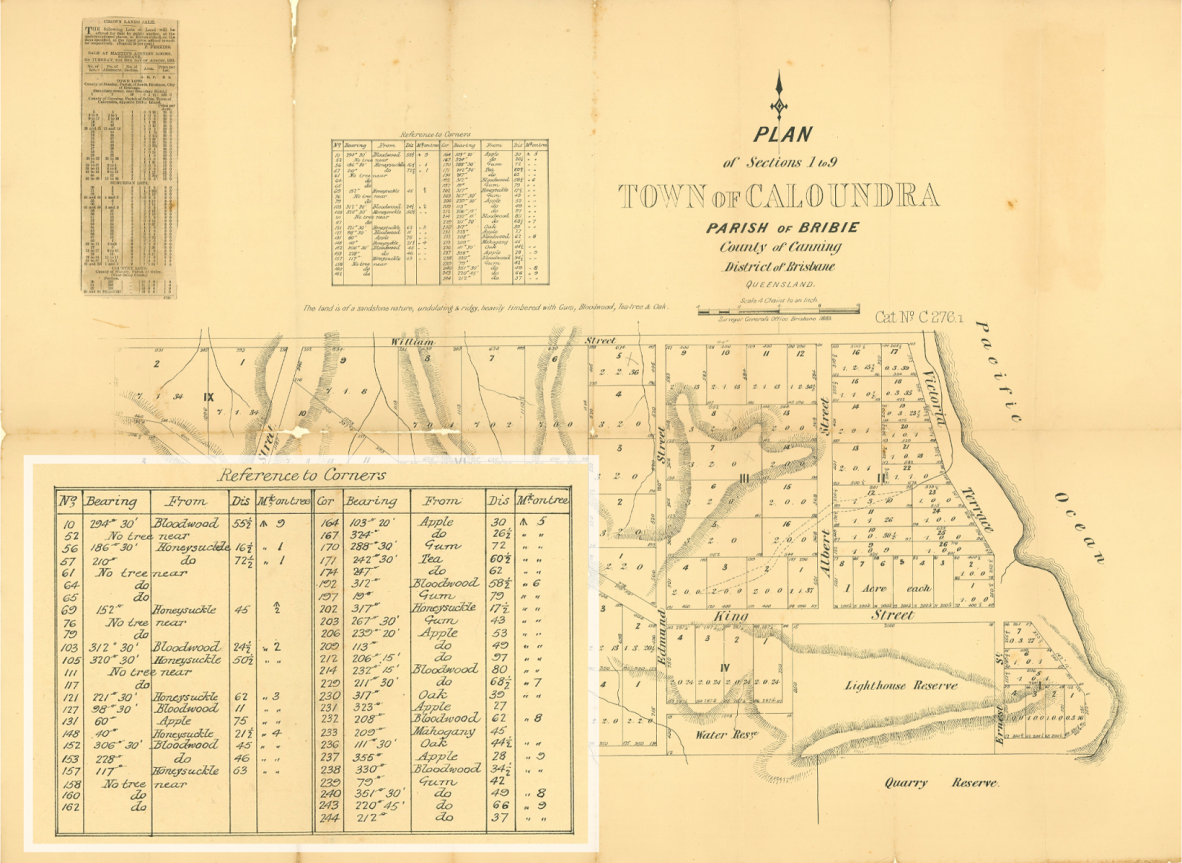
Town of Caloundra, 1883. John Oxley Library, State Library of Queensland. http://hdl.handle.net/10462/deriv/451642
Geological maps can provide information about the historical distribution of minerals, as well as the locations of mining leases. The map below of the Ravenswood goldfield shows the lease number, name of lease, claims, position of reefs, shafts, streets, and creeks. The busy, colourful overlapping boxes indicating leases and claims paint a picture of a bustling and thriving goldrush town. At its peak Ravenswood had a population of around 5000, and was home to 48 pubs. Following industrial action in 1912, the First World War and a decline in mining, by 1915 the town was all but deserted, and as of the 2021 census has a population of just under 300.
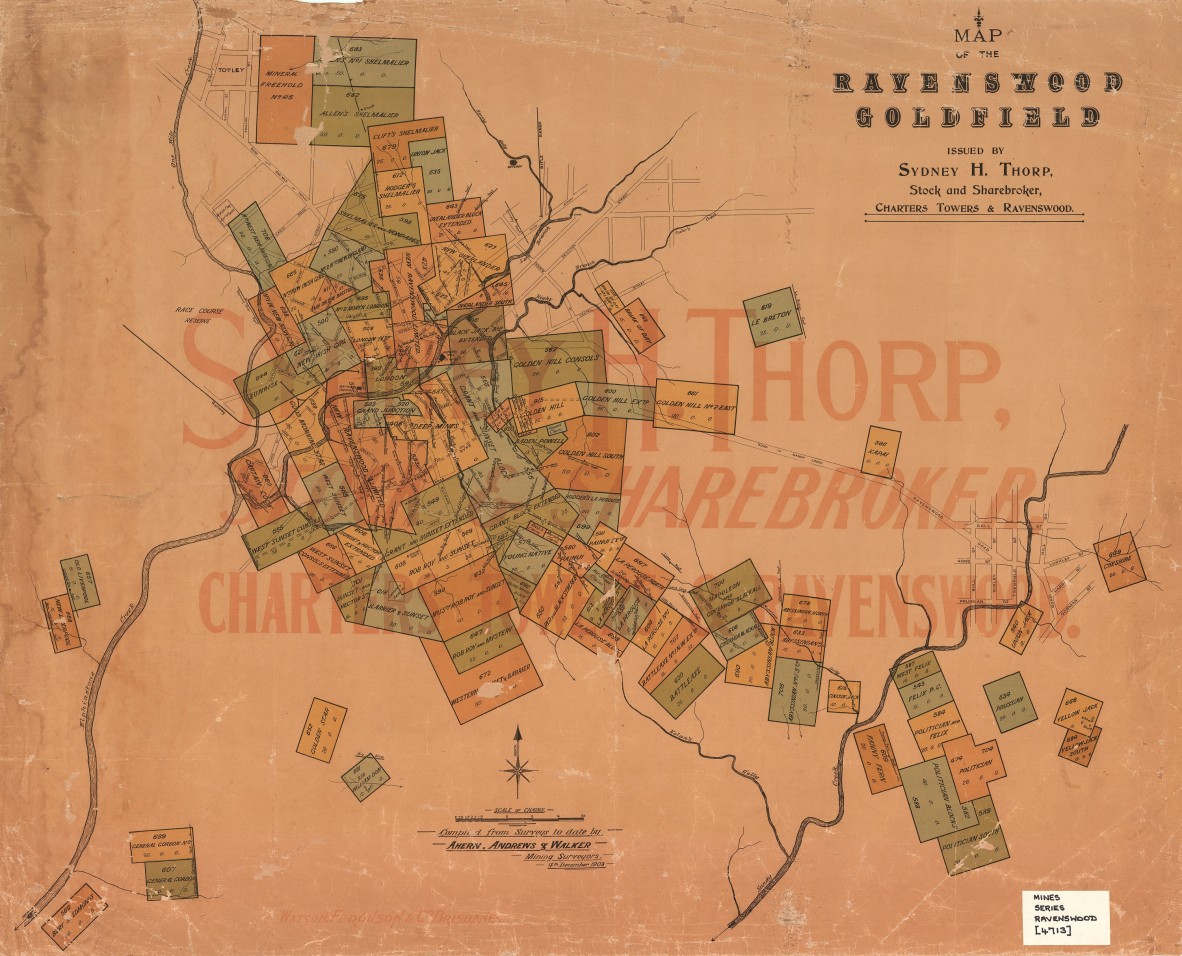
Map of the Ravenswood goldfields issued by Sydney H. Thorp. 1903. John Oxley Library, State Library of Queensland. http://hdl.handle.net/10462/deriv/499144
Finding maps in State Library’s collections
Finding maps in State Library’s collections is as easy as searching One Search. Many have been digitised and are available to be viewed online. Any that have not been digitised can be requested to be viewed in the John Oxley Library Reading Room. You will need to be a member to request collection material; if you haven’t already signed up you can do so on our membership page. Can’t find what you’re looking for? You can always Ask a Librarian.
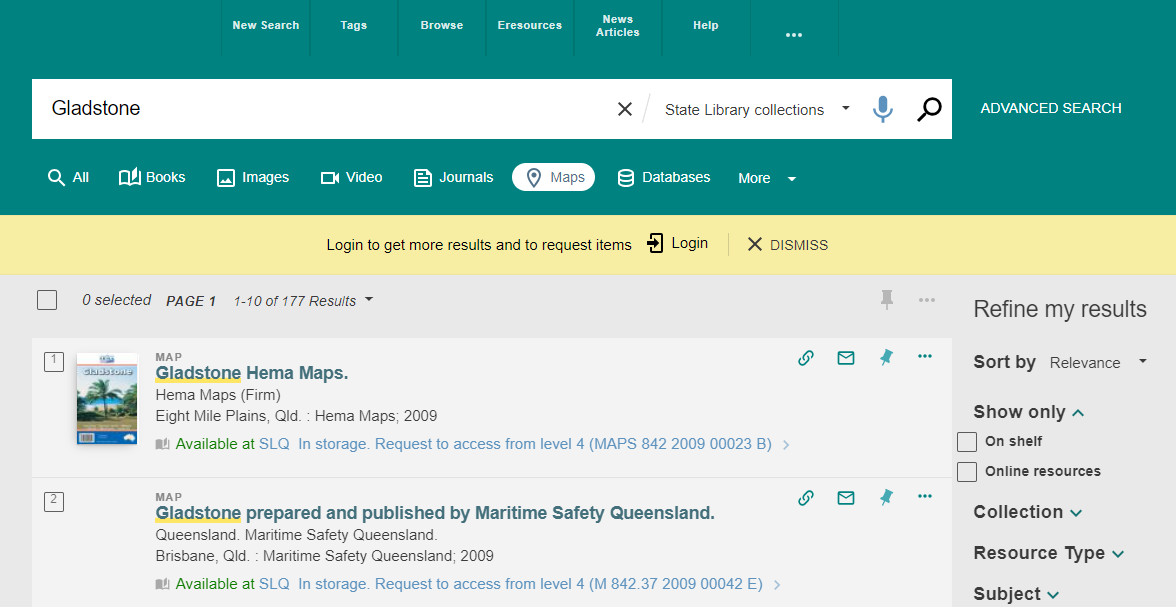
Finding maps in One Search
Other sources to find and explore Queensland maps
More information
One Search catalogue – https://onesearch.slq.qld.gov.auopen_in_new
Library membership – https://www.slq.qld.gov.au/services/membership
Ask a librarian - https://www.slq.qld.gov.au/services/ask-librarian
Plan your visit – https://www.slq.qld.gov.au/visit
Comments
Your email address will not be published.
We welcome relevant, respectful comments.